


Stock Market Recovered in 1994, 1998, and 2004
Stock-Markets / Stock Markets 2011 Aug 08, 2011 - 02:56 PM GMTBy: Chris_Ciovacco

 Our July 27 article, How Will A Downgrade of U.S. Debt Impact Stock and Bond Prices?, is obviously more relevant now. Since the news of Standard and Poor’s (S&P) downgrade of U.S. debt on Friday night, we have been reviewing the market’s current risk-reward profile and preparing for what should be another volatile week for investors.
On Sunday, we revisited our study of points in market history that are similar to the present day. Since we are dealing with human greed and fear, we can better understand the bull/bear odds in the present day by looking for differences between markets that should have been held (1994, 1998, 2004) and markets that should have been sold (2000).
The purpose of this exercise is not to imply that stocks and commodities should be blindly held in the current environment. Our intent is to show that (a) markets can recover after sleepless-night sell-offs, and (b) the 200-day moving average can help us better understand the market’s evolving risk-reward profile.
The chart below shows the S&P 500 as of the close on Friday, August 5, 2011. There is a high degree of fear and uncertainty reflected in the right side of the chart. In all the charts that follow, the S&P 500’s 200-day moving average is shown in blue. Notice in June 2011, stocks held near the 200-day moving average. Near point A-11 the slope of the 200-day has flattened out, but has not yet turned negative.
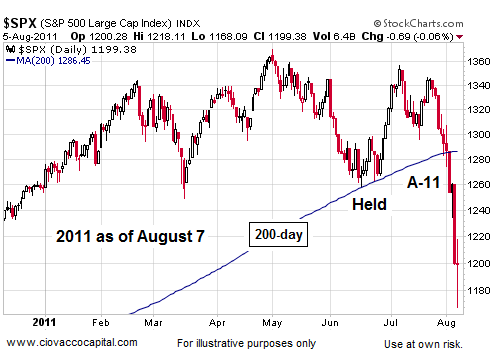
Without studying market history, you may believe a chart like the one above is extremely unique and will most certainly lead to a multi-year bear market in stocks. History tells us that ugly charts coupled with high levels of fear do not necessarily mean it is time to move to 100% cash.
The chart of the S&P 500 in 2004 below looks similar to the present day chart above. Like 2011, stocks held near the 200-day on the first pass in 2004 (below). Near point A-04 stocks dropped sharply below the 200-day moving average. Like 2011, the 200-day moving average in 2004 began to flatten out. Countless investors moved to 100% cash in 2004 as talk of a new bear market escalated.
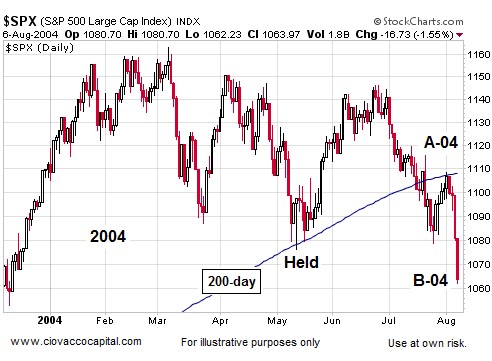
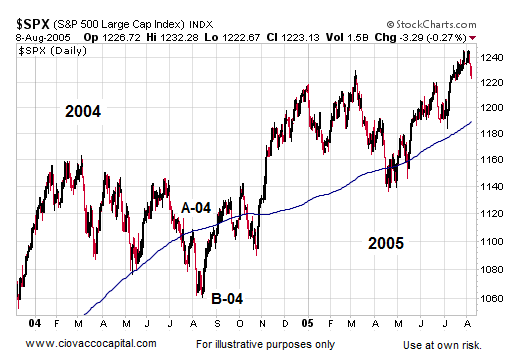
Unfortunately, investors who sold everything in 2004 missed a big rally after the fear subsided. The low near point B-04 occurred at 1,060. The S&P 500 rallied 48% after many ran for the exits in 2004. The peak of 1,576 on the S&P 500 was not made until October 2007. In 2004, the slope of the S&P 500’s 200-day did tick down very briefly, but stocks never made a lower low relative to point B-04. When the slope of the 200-day turned back up in November 2004, it indicted that the risk-reward ratio for stocks had improved.
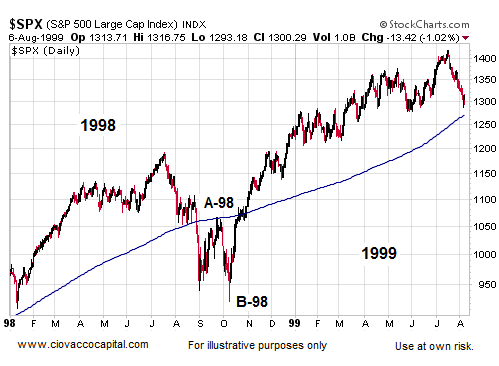
If you think the fear in today’s market is unique to bear markets, you probably were not investing in 1998. Like 2011, stocks held on their first pass at the 200-day moving average. Like 2011, the slope of the 200-day flattened out near point A-98. Like 2011, there was a very high level of fear and pessimism about the future near point B-98. Like 2004, in 1998 many investors couldn’t take it anymore and moved to 100% cash.
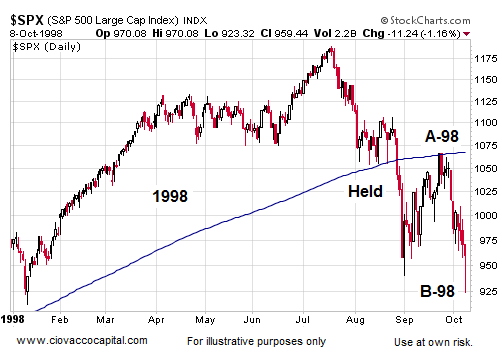
Like 2004, those who sold out in 1998 missed a big rally in stocks. The takeaway from the chart below is the 200-day never rolled over in a convincing manner in 1998. As of the close on August 5, 2011, the S&P 500’s 200-day moving average remained flat, similar to 2004 and 1998.
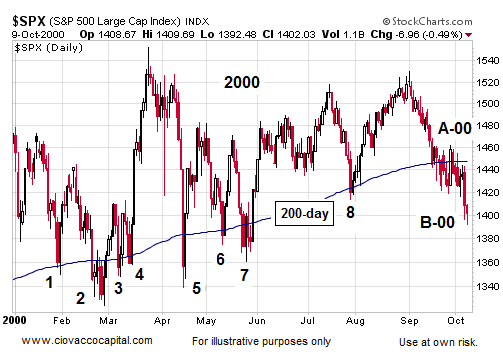
The year 2000 has come up in our screens as being technically similar to the present day. Unlike 1998, 2004, and 2011, the S&P 500 moved below its 200-day moving average eight times before peaking in September 2000. While the eight crosses of the 200-day do not compare well with the present day, notice the S&P 500 did hold up fairly well as long as the slope of the 200-day moving average remained positive or flat. The 200-day flattened out near point A-00 below indicating a deteriorating risk-reward profile for stocks.
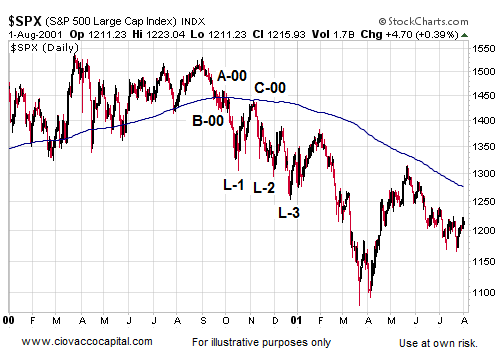
The market above should have been sold. Notice in the chart below the 200-day moving average turned over in a bearish manner near point C-00, which was a red flag. After the 200-day moving average turned over, stocks made three lower lows as shown by L-1, L-2, and L-3. These lower lows were another red flag. It is possible that the market in 2011 will morph into something similar to the chart below. If it does, we will significantly increase our allocation to defensive assets, such as cash, gold, silver, and conservative bonds.
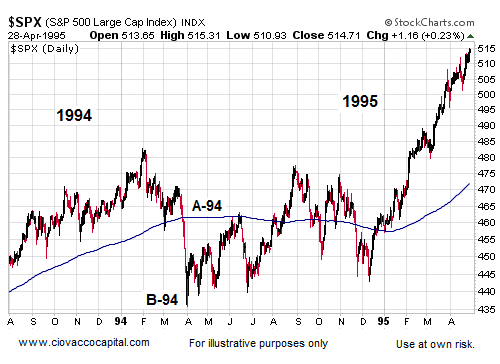
The most difficult case to manage through was 1994-1995. The chart of 1994 looks similar to 2011. Stocks held near the 200-day on the first pass. The slope of the 200-day moving average became flat near point A-94. Like 2011, prices dropped fast after breaking below the 200-day moving average.
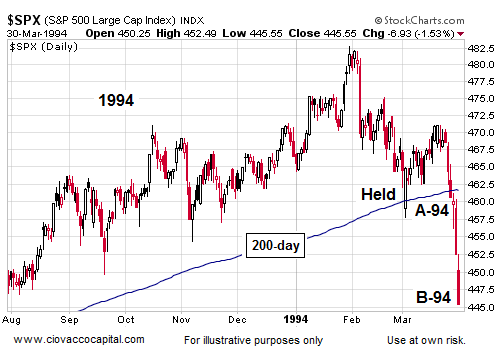
The difficult part about 1994 was the slope of the 200-day moving average turned negative to the right of point A-94. The key difference between 1994, a market that should have been held, and 2000, a market that should have been sold, is stocks never made a lower low below point B-94 in 1994. Also in 2000, the slope of the 200-day moving average never ticked back up in a bullish manner like it did in early 1995 in the chart below.
How does all this help us? The market has deteriorated enough in 2011 to react in a defensive manner, as we have by increasing our exposure to cash, holding our bonds, and adding to our gold (GLD) and silver (SLV) positions. If we pay attention to the present day in the context of history, we should be able to decide prudently if further defensive action is needed. Our ultimate goal is to understand if the odds favor a new bear market or higher highs in asset prices. The similar markets from 1994, 1998, 2000, and 2004 can improve our odds of success in the days and weeks ahead.
By Chris Ciovacco
Ciovacco Capital Management
-
Copyright (C) 2011 Ciovacco Capital Management, LLC All Rights Reserved.
Chris Ciovacco is the Chief Investment Officer for Ciovacco Capital Management, LLC. More on the web at www.ciovaccocapital.com
Ciovacco Capital Management, LLC is an independent money management firm based in Atlanta, Georgia. As a registered investment advisor, CCM helps individual investors, large & small; achieve improved investment results via independent research and globally diversified investment portfolios. Since we are a fee-based firm, our only objective is to help you protect and grow your assets. Our long-term, theme-oriented, buy-and-hold approach allows for portfolio rebalancing from time to time to adjust to new opportunities or changing market conditions. When looking at money managers in Atlanta, take a hard look at CCM.
All material presented herein is believed to be reliable but we cannot attest to its accuracy. Investment recommendations may change and readers are urged to check with their investment counselors and tax advisors before making any investment decisions. Opinions expressed in these reports may change without prior notice. This memorandum is based on information available to the public. No representation is made that it is accurate or complete. This memorandum is not an offer to buy or sell or a solicitation of an offer to buy or sell the securities mentioned. The investments discussed or recommended in this report may be unsuitable for investors depending on their specific investment objectives and financial position. Past performance is not necessarily a guide to future performance. The price or value of the investments to which this report relates, either directly or indirectly, may fall or rise against the interest of investors. All prices and yields contained in this report are subject to change without notice. This information is based on hypothetical assumptions and is intended for illustrative purposes only. THERE ARE NO WARRANTIES, EXPRESSED OR IMPLIED, AS TO ACCURACY, COMPLETENESS, OR RESULTS OBTAINED FROM ANY INFORMATION CONTAINED IN THIS ARTICLE. PAST PERFORMANCE DOES NOT GUARANTEE FUTURE RESULTS.
Chris Ciovacco Archive |
© 2005-2022 http://www.MarketOracle.co.uk - The Market Oracle is a FREE Daily Financial Markets Analysis & Forecasting online publication.