


The Stock Market SP500 Index Could Bottom at 1096-1100
Stock-Markets / Stock Markets 2011 Aug 09, 2011 - 03:07 AM GMTBy: David_Banister

 The markets bottomed last Friday at 1168 roughly on the SP 500, then violently reversed with a 47 point rally to 1215. I had forecasted a likely short term bottom at 1176/1188 ranges with a possible 60 point rally coming. With that said, I didn’t think it would all happen in nearly 1 trading day.
On Friday night, as most now know… Standard and Poor’s downgraded the US Debt rating to aa+ from AAA. I would suspect that the bigger players already knew this a few days prior and were short the market with that information. My pure speculation here is that within the first hour that some of these same participants will have covered their shorts and probably be looking to buy some calls or get long certain stocks if there is short term panic and we reach oversold short term extremes.
Clearly though the patterns suggest we are in a bear cycle as evidenced by the 1233 break last week, but there will be tons of trading opportunities with violent rallies along the way as well, trying to time those will be the hard part.
One of the downsides to owning shares in companies in the public markets is that panic and hysteria can very quickly mis-price a security that represents shares in a company to well below where it would be valued as a private ongoing business. This however also represents opportunity for those with the right time horizon and the stomach to accumulate when there is a mis-pricing of those securities.
I can already find many samples of small cap firms where they are not trading dramatically above cash per share and certainly below total fair value per share given their assets. I will be looking at some point to scale into a few of these companies given that they are trading below a fair private value in the public markets.
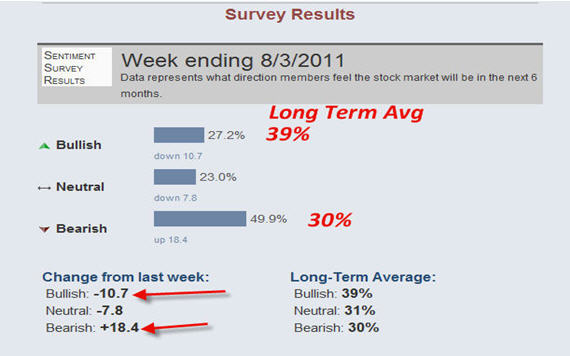
With that said, where does the broader market go on Monday? Nobody knows, and certainly the sentiment gauges as of last Wednesday had turned historically very bearish prior to the Thursday and Friday drops.
Note below we have an increase as of last Wednesday of Bears by 18% to historically extremely high levels. Bulls were down to 27%, which is historically about 12 points below the average. Source: American Association of Individual Investor’s August 3rd survey:
Many traders who were formerly clinging bullish were caught in a stop loss and margin call induced liquidation late in the week. I would guess that hangers on will be equally caught on Monday this week in margin calls and possible stop loss sweeps.
The smart thing to do is not panic and make sure you understand the valuation of the business you own shares in if you have stocks, and decide how crazy the market participants may get in their voting near term.
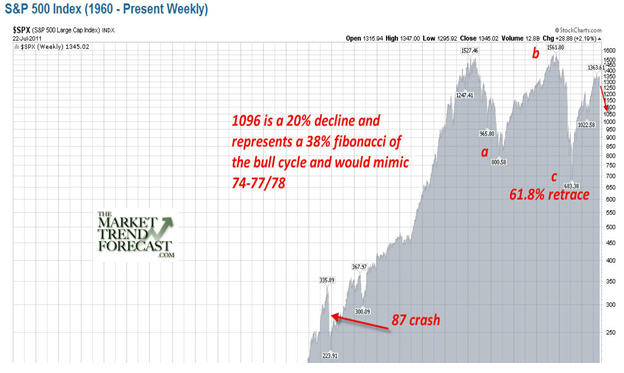
When the SP 500 fell below my 1233 line in the sand, it pretty much confirmed a new Bear Market for me, even with the 1168 pivot on Friday. The last very outside shot for Bulls intermediately was for 1168 to hold and run, but we may or may not do that on Monday or this coming week. The Elliott Wave patterns are confirmed bearish with the 1233 break, and so other than some miraculous turnaround off the 1168 pivot that holds…we must remain cautious. I was looking for a trading range from 1176-1260/80 for a while as MOST LIKELY…. but all we can do is find out to what extent cool heads prevail or not this coming week and I’ll update from there. Right now the weekly charts are super oversold like November of 2008. With that said, I make a case for a possible bottom around 1096 now on the SP 500 as possible worst case.
In this history of the markets, we had a major bottom on the SP 500 in 1974 which was followed by a 25 year bull cycle to 1999. On March 9th 2009, we bottomed at 666 and re-traced a Fibonacci 61.8% of that entire 25 year bull cycle over 8-9 years in ABC Fashion, which would makes sense.
Just prior to that I forecasted a major bottom on February 25th with an article, “Is the Market about to Bottom and Nobody Knows It?” You can Google it to find it.
Now with hindsight, we see 1370 hit on the Bin Laden killing and that was a 78.6% retracement of the 07 highs to 09 lows. However, dialing back to the 1974 low, we rallied into 1977 in 3 wave fashion to the 1977 highs, went sideways awhile… we then had a major drop from 107 to about 87 on the Index over about 12 months… corrected a good 20%. Does history repeat in 2009-11? We rallied in 3 waves, we have gone sideways… and then we drop 20% or so? If so, that takes the SP 500 to about 1096… Another 104 points. At 1096 that would represent a 38% Fibonacci retracement of the Bull cycle from 666 to 1370.
Food for thought… if you’d like to get more frequent forecast updates on the SP500, Gold, and Silver please look at www.MarketTrendForecast.com and take advantage of our 33% discount option.
Dave Banister
CIO-Founder
Active Trading Partners, LLC
www.ActiveTradingPartners.com
TheMarketTrendForecast.com
Dave Banister is the Chief Investment Strategist and commentator for ActiveTradingPartners.com. David has written numerous market forecast articles on various sites (SafeHaven.Com, 321Gold.com, Gold-Eagle.com, TheStreet.Com etc. ) that have proven to be extremely accurate at major junctures.
© 2011 Copyright Dave Banister- All Rights Reserved
Disclaimer: The above is a matter of opinion provided for general information purposes only and is not intended as investment advice. Information and analysis above are derived from sources and utilising methods believed to be reliable, but we cannot accept responsibility for any losses you may incur as a result of this analysis. Individuals should consult with their personal financial advisors.
© 2005-2022 http://www.MarketOracle.co.uk - The Market Oracle is a FREE Daily Financial Markets Analysis & Forecasting online publication.