


Silver Parabola’s & Consolidations
Commodities / Gold and Silver 2011 Aug 09, 2011 - 03:19 AM GMTBy: Willem_Weytjens

 Please have a look at the next charts, that show us what happened after a silver Parabola burst.
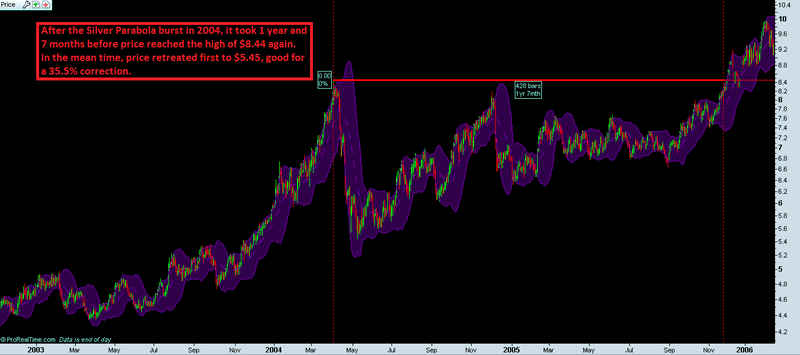
Chart created with Prorealtime Charting Software
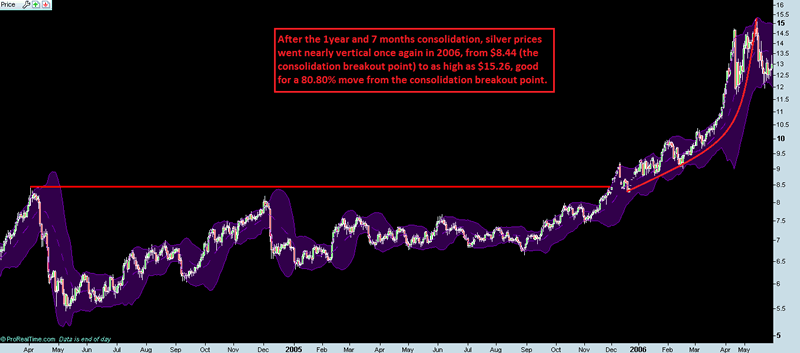
Chart created with Prorealtime Charting Software
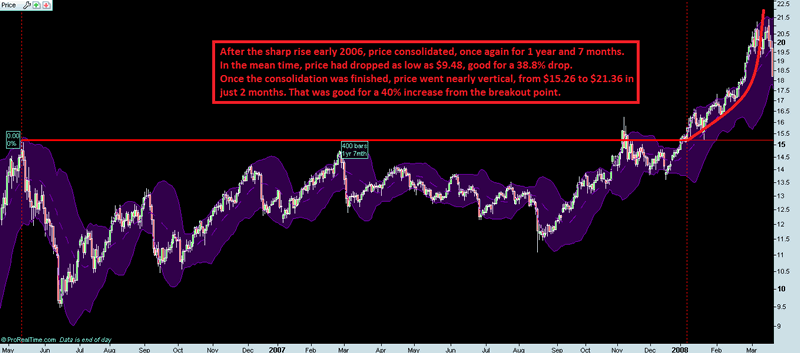
Chart created with Prorealtime Charting Software
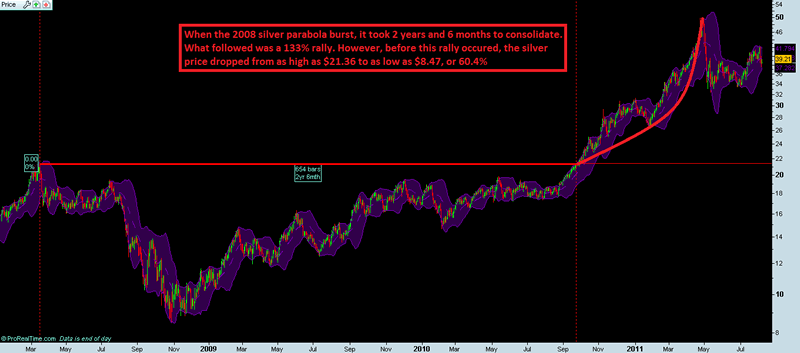
Chart created with Prorealtime Charting Software
The following chart is an updated version of THIS ARTICLE.
We took the 1993 low of $3.50 as the 0% Fibonacci level and then drew several Fibonacci Retracement levels, whereby the 38.20% levels coincided with the consolidation levels. We can see that after the 3 previous peaks, price always retreated at least to the 50% level. The current correction was halted at the 61.80% level.
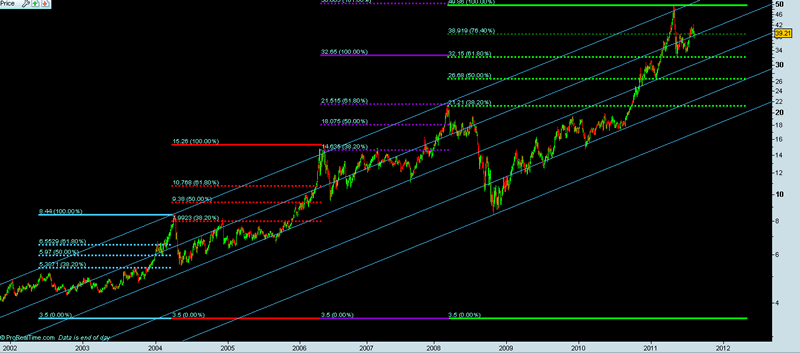
Chart created with Prorealtime Charting Software
As the charts above show us, when a parabola bursts, it takes time – a lot of time – before the next leg up begins.
Will this time be any different, or are silver prices headed for more correction?
To find out, visit www.profitimes.com and follow us on Twitter for the latest posts
Willem Weytjens
www.profitimes.com
© 2011 Copyright Willem Weytjens - All Rights Reserved
Disclaimer: The above is a matter of opinion provided for general information purposes only and is not intended as investment advice. Information and analysis above are derived from sources and utilising methods believed to be reliable, but we cannot accept responsibility for any losses you may incur as a result of this analysis. Individuals should consult with their personal financial advisors.
© 2005-2022 http://www.MarketOracle.co.uk - The Market Oracle is a FREE Daily Financial Markets Analysis & Forecasting online publication.