Gold Warning, Cyclical 34 Month Bull Run is About to End
Commodities / Gold and Silver 2011 Aug 11, 2011 - 03:38 PM GMTBy: David_Banister
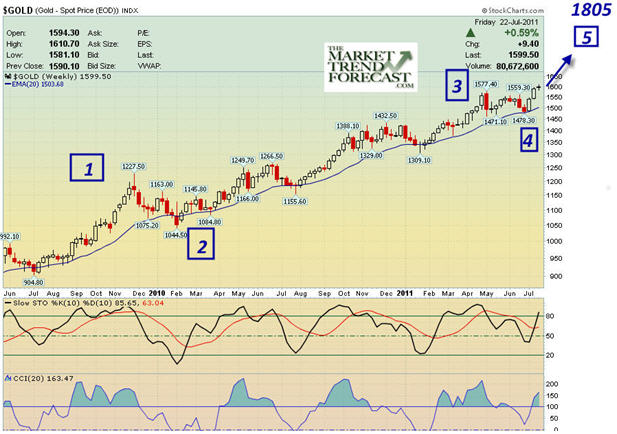
 Gold hit $1805 tonight in trading, a Fibonacci Fractal figure I gave out a few weeks ago as a possible top. We are close to a near term high in Gold and Investors should be trimming back positions on this run. Back as recently as $1600 an ounce I forecasted a run to $1805 for Gold using fractal and wave analysis and behavioral patterns, now that we hit that figure it’s time to update the cycle and where we are.
Here is the Chart I did at 1599 gold on July 22nd:

I have been a Gold Bull since November 2001, having conducted seminars for public employees on investing back then and advising gold mutual funds and gold stocks very early. I have talked in the past about a 13 fibonacci year Gold Bull cycle that will end around 2014, so there are still three years left in my opinion. However, gold does have peaks and valleys and has moved in very clear Wave and Fibonacci fractal patterns for years.
Given the history of how I have forecasted Gold, I am going to share my short term and moderately long term views on where we are in the up cycle which I expect to last 13 fibonacci years to 2014. Right now it is my opinion that we are completing a MAJOR WAVE 3 up in Gold from the 2001 lows from $300 an ounce. We have had a 34 fibonacci month rally since the October 2008 lows of $681 per ounce. Every Taxi driver, CNBC guest or analyst, and 200 Radio and TV commercials a day are blaring to buy Gold. This is how intermediate tops form.
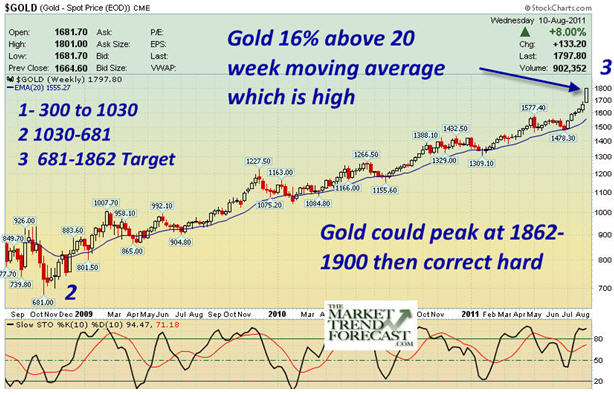
The rough wave count is below:
Wave 1- 300 to 1030
Wave 2- 1030 to 681 (October 2008 lows)
Wave 3- 618- 1805 currently, 34 Fibonacci month cycle. *Likely high is 1862-1900*
Wave 4- Due up next… a multi month consolidation
It is my opinion that at the top of a Major wave 3 in Gold, that everyone should be univerally bullish, that gold radio and TV commercials would be all over the place, and that everyone on CNBC would be talking about and recommending Gold.
Sound familiar?
So the likely conclusion to this massive parabolic blow off top of Wave 3 is nigh. Most recently I upped my estimates to as high as $1900 per ounce with $1805 already here as of tonight, which was one of my figures by the way many weeks ago. Gold should under normal circumstances top between 1862 and 1900 per ounce fairly soon should the 1805 level not hold as a high. At that level we will be dramatically overbought. We are already running 15.7% above the 20 week moving average line which historically is about as high as Gold will get before correcting hard and consolidating. A final lift to the 1862-1900 ranges should lead to a fairly good sized correction to the downside designed to kick all the late comer Taxi Cab driving buyers off the bull’s back. With that said, at $1805 I would be trimming my position and or hedging my long positions aggressively.
Watch for a Maximum Gold top at 1862 -1900 per ounce and keep in mind 1805 is being hit tonight and that is a qualifying fibonacci fractal top as well. Investors should be trimming back positions and looking to re-deploy back into Gold at better prices. We could get a huge blow off top over 1900, but it would be very very rare if it happens.

If you’d like to stay ahead of the peaks and valleys in Gold, Silver, and the SP 500 (Recently called a tradable bottom at 1101), then check out www.MarketTrendForecast.com for a 33% 48 hour coupon or sign up for the occasional but infrequent free updates.
Dave Banister
CIO-Founder
Active Trading Partners, LLC
www.ActiveTradingPartners.com
TheMarketTrendForecast.com
Dave Banister is the Chief Investment Strategist and commentator for ActiveTradingPartners.com. David has written numerous market forecast articles on various sites (SafeHaven.Com, 321Gold.com, Gold-Eagle.com, TheStreet.Com etc. ) that have proven to be extremely accurate at major junctures.
© 2011 Copyright Dave Banister- All Rights Reserved
Disclaimer: The above is a matter of opinion provided for general information purposes only and is not intended as investment advice. Information and analysis above are derived from sources and utilising methods believed to be reliable, but we cannot accept responsibility for any losses you may incur as a result of this analysis. Individuals should consult with their personal financial advisors.
© 2005-2022 http://www.MarketOracle.co.uk - The Market Oracle is a FREE Daily Financial Markets Analysis & Forecasting online publication.


