


Stock Market Technicals Suggest Cascading Bear Market Coming
Stock-Markets / US Stock Markets Dec 05, 2007 - 12:08 AM GMTBy: Brian_Bloom
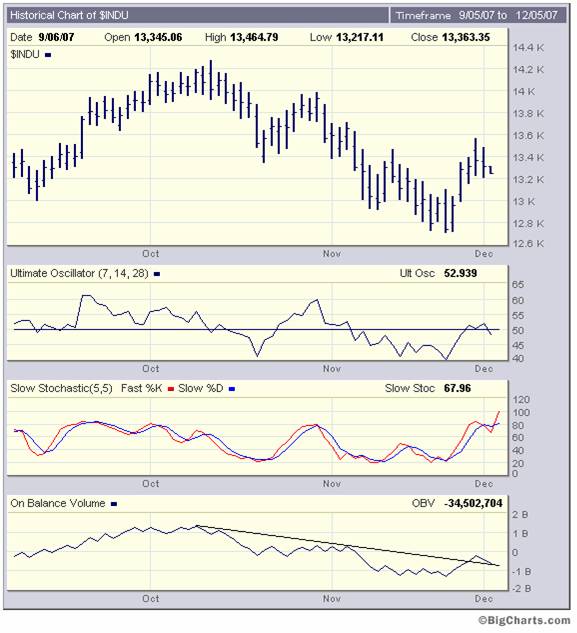
 The three month daily chart below is showing a sell signal on momentum oscillators, an overbought “slow” stochastic, and an OBV buy signal that looks like it wants to abort.
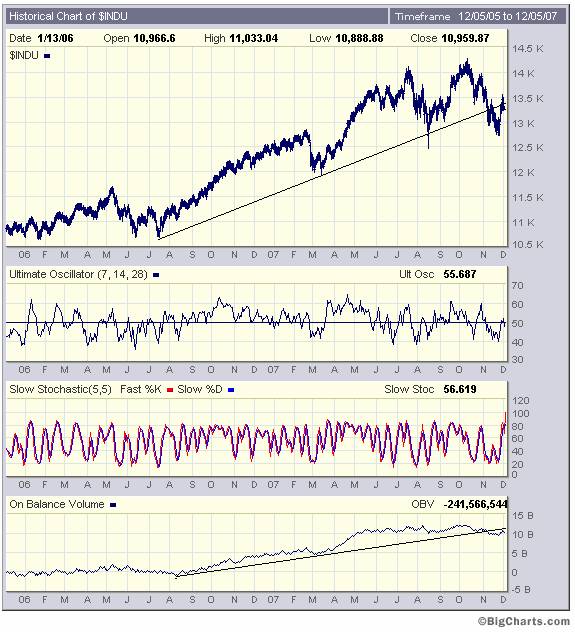
By contrast, the 2 year chat below is showing that the “apparent” buy signal on the OBV was nothing but a technical reaction back up to the rising trendline which had been broken on the downside in early November
Summary
The charts, courtesy Bigcharts.com , when read together look ominous :
Back in early November, the Dow Jones Industrial Index broke down through a rising trendline and rose back towards it in a classic technical reaction. The stochastic is now overbought, the OBV sell signal given in early November is intact, and the momentum indicator is giving a sell signal.
Conclusion
Hang onto your hats. The next few weeks/months are not going to be happy times.
Recommendation
I hope you guys are all out of the markets (except for special situations based on undervalued fundamentals). If not, my suggestion is that you get out immediately.
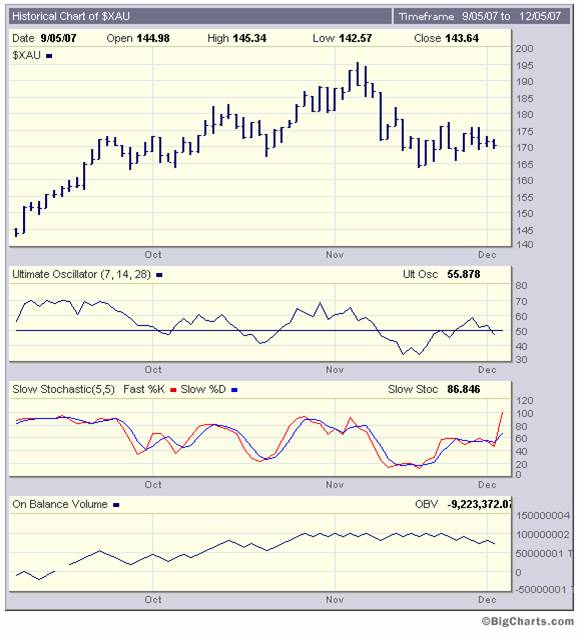
Paradoxically, it looks like the gold shares may get caught in the down draught. I've decided to hold mine for the longer term in the belief that the euro price of gold will soon break up convincingly. Nevertheless, in the short term (as can be seen from the following $XAU chart) the same patterns are manifesting.
By Brian Bloom
Author's comment : If you would like to see how the whole jigsaw puzzle fits together – such that the pathway forward becomes visible also to you – please register your interest to acquire a copy of my novel at www.beyondneanderthal.com . It is being targeted for publication towards the end of March 2008.
Copyright © 2007 Brian Bloom - All Rights Reserved
Brian Bloom Archive |
© 2005-2022 http://www.MarketOracle.co.uk - The Market Oracle is a FREE Daily Financial Markets Analysis & Forecasting online publication.