Stocks Rally Back Toward 1,260 Possible Even If Bear Market Has Kicked-Off
Stock-Markets / Stock Markets 2011 Aug 15, 2011 - 12:18 PM GMTBy: Chris_Ciovacco
 We are participating in a PIMCO conference call this morning with Mohamed A. El-Erian and Bill Gross. PIMCO is very well connected and knowledgeable regarding the bond markets. We may be able to gain some insight into the debt problems in Europe and the United States. Serious debt problems remain and the solutions are not going to be easy since haircuts and negative impacts will be involved.
We recently outlined some bearish concerns in Parallels To 2000 And 2008 Should Not Be Ignored. It is very important to understand that even if we have already entered a bear market:
- We may not know it for several months.
- Stocks could rally back toward 1,260.
- A move to 1,260 represents a gain of 7.5%.
- A break above 1,260 could reinvigorate the bull market.
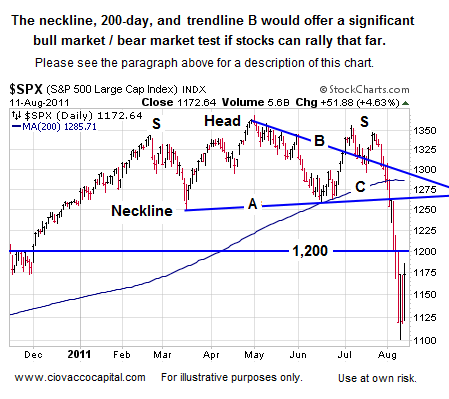
How the market behaves near 1,260 (if we get there) will be very telling. The chart below shows the S&P 500’s next major hurdle sits near 1,200. A break above 1,200 could lead to a swift move toward the bottom of the head-and-shoulders neckline (labeled A). Other bull market tests take the form of the now downward-sloping 200-day moving average (labeled C) and the downward-sloping trendline (labeled B). The point is we will know much more about the risk-reward profile of stocks and commodities based on how the S&P 500 fares at the three points of possible resistance (A, B, and C).

If the S&P 500 fails below A, B, and C above, then we would most likely sell a good portion of our remaining exposure to stocks. Another option would be to hedge our current positions near A, B, and C. A hedge could take the form of a vehicle like the ETF SH, which goes up when the S&P 500 goes down.
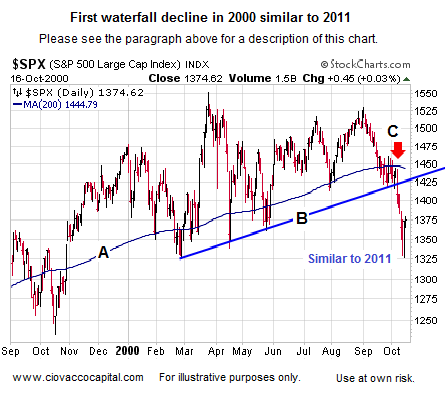
A very similar bear market rally occurred in 2000. The chart below shows a drop similar to the recent waterfall decline in stocks. Notice, like today, the 200-day moving average had already turned down in 2000 (see red arrow near C), which leaned bearish.

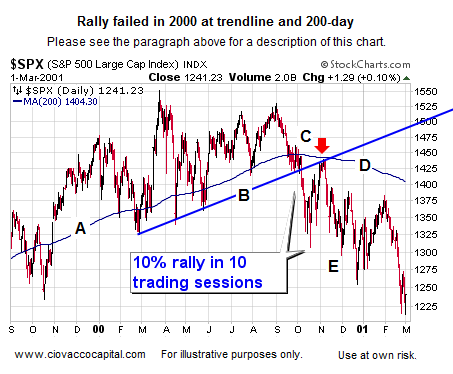
In 2000, stocks rallied hard back toward the previous trendline, which is labeled B below. The 200-day continued to roll over (near D), which meant the odds of the rally failing were much higher than under typical bull market conditions.

After the sharp rally where it was declared “we have found a bottom”, stocks reversed near the intersection of the 200-day and the blue trendline B (near point C and red arrow). If the present day rally approaches similar obstacles (200-day and trendline/neckline), it will be a very big test for the sustainability of the bull market. If the 200-day is noticeably sloping downward as stocks approach it, we will be skeptical, but open to, a bullish resolution.

The scenario above is one of many possible scenarios that could play out, but it suggests that having a mixed approach with some stocks, some cash, and precious metals is appropriate until we get some more clarity regarding the issues above. If stocks make a lower low, rather than rallying, we will look for bullish divergences on the way back down. If they exist, we will be patient. If they do not, we will continue to cut back on our exposure to risk.
We did a study this week looking for high probability ETFs relative to a possible move back toward 1,260; more information, including some ETF symbols, can be found in the Twitter post “ETF Screen for Possible S&P 500 Neckline Rally”. Some other important levels to watch on any rally attempt are shown below.

By Chris Ciovacco
Ciovacco Capital Management
-
Copyright (C) 2011 Ciovacco Capital Management, LLC All Rights Reserved.
Chris Ciovacco is the Chief Investment Officer for Ciovacco Capital Management, LLC. More on the web at www.ciovaccocapital.com
Ciovacco Capital Management, LLC is an independent money management firm based in Atlanta, Georgia. As a registered investment advisor, CCM helps individual investors, large & small; achieve improved investment results via independent research and globally diversified investment portfolios. Since we are a fee-based firm, our only objective is to help you protect and grow your assets. Our long-term, theme-oriented, buy-and-hold approach allows for portfolio rebalancing from time to time to adjust to new opportunities or changing market conditions. When looking at money managers in Atlanta, take a hard look at CCM.
All material presented herein is believed to be reliable but we cannot attest to its accuracy. Investment recommendations may change and readers are urged to check with their investment counselors and tax advisors before making any investment decisions. Opinions expressed in these reports may change without prior notice. This memorandum is based on information available to the public. No representation is made that it is accurate or complete. This memorandum is not an offer to buy or sell or a solicitation of an offer to buy or sell the securities mentioned. The investments discussed or recommended in this report may be unsuitable for investors depending on their specific investment objectives and financial position. Past performance is not necessarily a guide to future performance. The price or value of the investments to which this report relates, either directly or indirectly, may fall or rise against the interest of investors. All prices and yields contained in this report are subject to change without notice. This information is based on hypothetical assumptions and is intended for illustrative purposes only. THERE ARE NO WARRANTIES, EXPRESSED OR IMPLIED, AS TO ACCURACY, COMPLETENESS, OR RESULTS OBTAINED FROM ANY INFORMATION CONTAINED IN THIS ARTICLE. PAST PERFORMANCE DOES NOT GUARANTEE FUTURE RESULTS.
Chris Ciovacco Archive |
© 2005-2022 http://www.MarketOracle.co.uk - The Market Oracle is a FREE Daily Financial Markets Analysis & Forecasting online publication.


