Did Gold Just Create a Short-Term Bottom?
Commodities / Gold and Silver 2011 Aug 16, 2011 - 11:40 AM GMTBy: Eric_McWhinnie
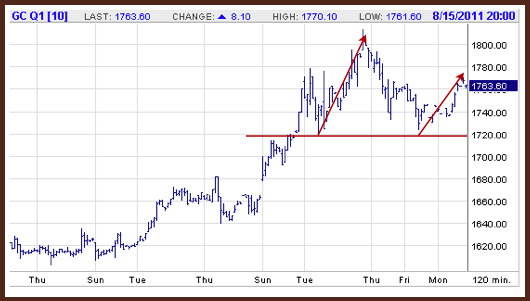
On Monday, the Dow (NYSE:DIA), S&P 500 (NYSE:SPY), and oil (NYSE:USO) all continued to rally from previous lows they made the prior week. Gold (NYSE:GDL) broke through $1800 last week, but declined going into the weekend as margins were raised against the yellow metal. On Friday, gold dipped to as low as $1723 before rebounding, which brings us to an important support level for gold.
The chart below details the short-term significance of $1720 for gold. Investors should take notice how gold rebounded strongly when $1720 was approached. The price level of $1720 previously acted as resistance, but now it is acting as support.

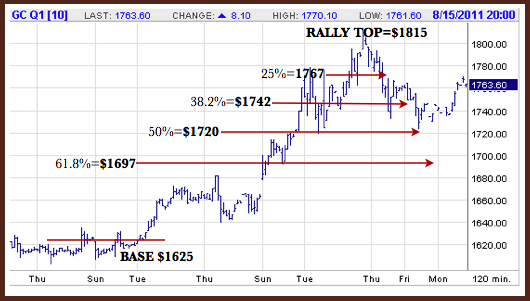
The chart listed below also shows another reason to pay attention to the $1720 price level in gold. The chart is listed with Fibonacci price levels at a 25%, 38.2%, 50%, and 61.8% retracement. Fibonacci retracement is a popular technical analysis tool investors may use to help determine the severity of a pullback after a well defined rally. The 50% retracement is technically not a Fibonacci number, but is often included in the analysis. For the rally that took gold to $1815, we will use a base of $1625, where gold built a launch pad to shoot $190 higher.

Once again, the $1720 price level serves as a key target using the 50% retracement level. Yesterday, gold futures gained for the first time in three sessions. Technical analysis alone doesn’t explain the support level of $1720, but it helps to paint a clearer picture. The U.S. Dollar (NYSE:UUP) also gave gold (NYSE:GLD) and silver (NYSE:SLV) a boost on Monday as it sank lower. Although long-term holders of precious metals (NYSE:DBP) are less concerned with the daily and weekly market noise, short-term traders should keep an eye on the $1720 support level. If support there fails, additional support from the 61.8% retracement level can be seen at $1697, which coincides closely with the psychological support of $1700.
Investors looking to hold precious metals in their portfolio may want to consider gold plays such as AngloGold (NYSE:AU), Newmont Mining (NYSE:NEM), or Market Vectors Jr Gold Miners ETF (NYSE:GDXJ). Hot silver plays include First Majestic Silver (NYSE:AG), Endeavour Silver (AMEX:EXK), and Global X Silver Miners ETF (NYSE:SIL).
For more analysis on our support levels and ranges for gold and silver, consider a free 14-day trial to our acclaimed Gold & Silver Investment Newsletter.
Disclosure: Long AGQ.
By Eric_McWhinnie
Wall St. Cheat Sheet : Only days after the S&P 500 crashed to the depths of hell at 666, the Hoffman brothers launched Wall St. Cheat Sheet: one of the fastest growing financial media sites on the web. Like a samurai, our mission is to cut through the bull and bear shit with extraordinary insights, a fresh voice, and razor-sharp wit. We provide the highest quality education and information for active investors, financial professionals, and entrepreneurs.
© 2011 Copyright Eric McWhinnie - All Rights Reserved
Disclaimer: The above is a matter of opinion provided for general information purposes only and is not intended as investment advice. Information and analysis above are derived from sources and utilising methods believed to be reliable, but we cannot accept responsibility for any losses you may incur as a result of this analysis. Individuals should consult with their personal financial advisors.
© 2005-2022 http://www.MarketOracle.co.uk - The Market Oracle is a FREE Daily Financial Markets Analysis & Forecasting online publication.


