Gold Now Monstrously Overbought
Commodities / Gold and Silver 2011 Aug 22, 2011 - 02:25 AM GMTBy: Clive_Maund
 In the last update, despite being extremely overbought, gold was expected to advance to even higher levels, for various reasons, principally the COT readings and the bullish volume pattern. We gave a target in the $1900 area, and that target was very nearly attained on Friday when gold hit $1881 intraday, before reacting back to close well well off its day's highs.
Gold is now monstrously overbought and has finally caught the attention of the mainstream media who are all over it. These factors alone are regarded as making the probably of it reversing soon very high, and if we look at the charts we can see good reasons why it should react back shortly.
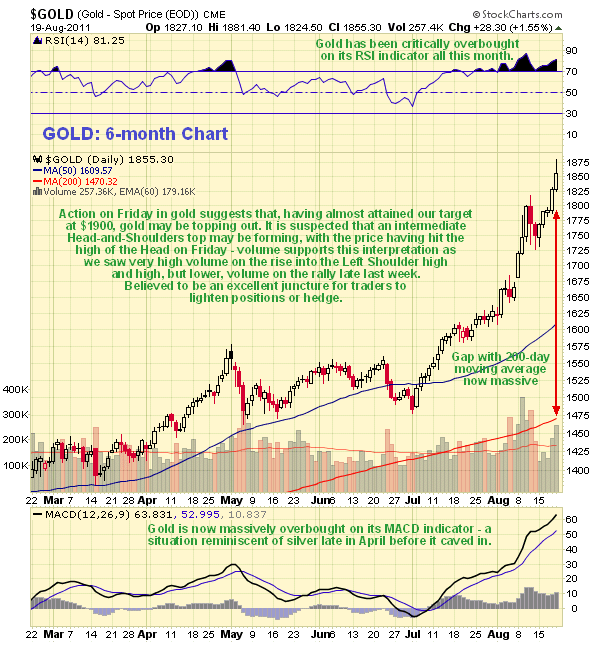
On all its short and medium-term oscillators gold is now horrendously overbought. We can see that on our 6-month chart with gold now super critically overbought on its short-term RSI, with it having been critically overbought all this month to date on this indicator. Meanwhile on its more medium-term MACD indicator it is now massively overbought - these conditions being reminiscent of silver late in April. In addition it has opened up a now huge gap with its moving averages.

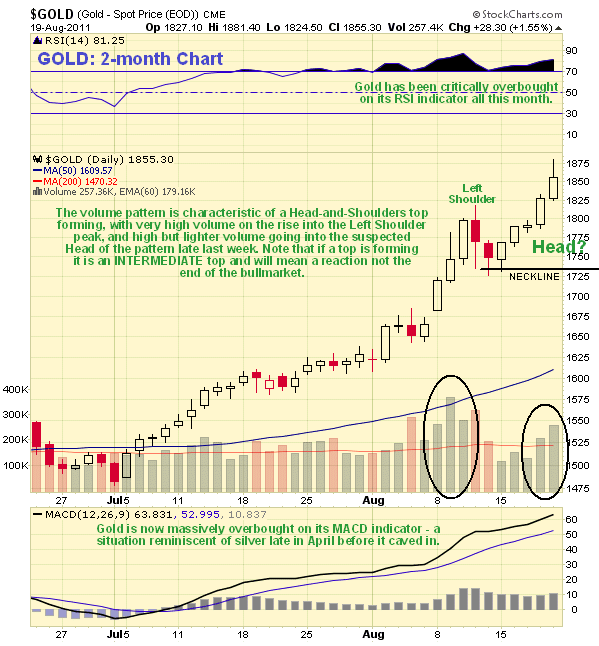
Although it did not qualify as a bearish shooting star, the candlestick that formed on Friday, with its long upper shadow, is viewed as an indication of exhaustion, or near exhaustion, and thus as a warning. After further consideration of this latest chart it is suspected that an intermediate Head-and-Shoulders top could be forming in gold as shown on the 2-month chart below, with the price possibly having hit the high of the Head of this pattern on Friday, after the Left Shoulder formed earlier in the month, around the 10th. The volume pattern supports this hypothesis, with very high volume going into the Left Shoulder and high but lesser volume on the rally into the suspected Head of the pattern late last week.

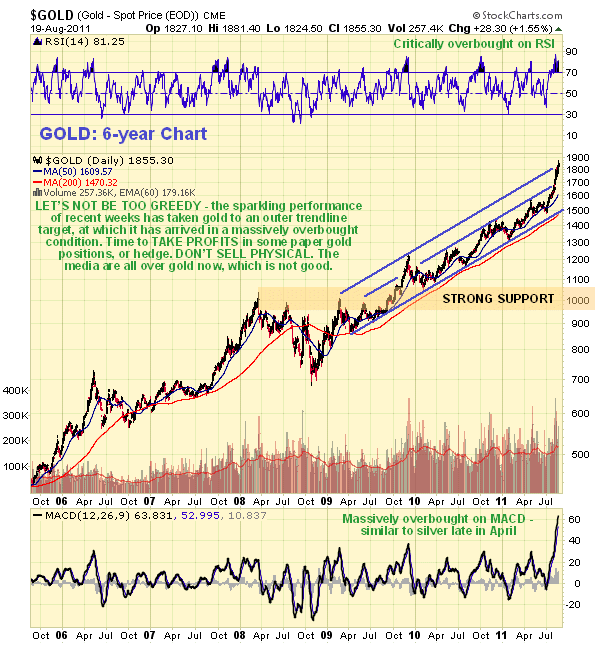
When you stop and think about it, it is not unreasonable for gold to top out here and take a rest after after its recent spectacular run. On our 6-year chart below we can see that it has risen to hit a target at the upper return line of its long-term uptrend channel. The bird-brained commentators on the telly are now talking about it a lot, and as we know they have a tendency to do that once something has already risen 500 - 1000% as gold has done after the last 10 years. Actually, they are not as stupid as we may think, as one reason for their huge salaries is that they are paid to drum up a market for Smart Money to sell into, once something has risen a lot.

Gold's COT chart looks about the same as last week, although the Commercial's short positions can be presumed to have risen in recent days (the chart, not shown, is up to date only as of last Tuesday's close).
With gold remaining firmly in a long-term bullmarket, there is thought to be no justification for selling bullion, which could be difficult or impossible to replace later. Instead, holders of bullion may temporarily hedge their positions to preserve gains accrued to date. Traders in the surreal paper gold market can likewise hedge positions or take partial profits on holdings here to sidestep an expected reaction.
One possible reason for gold dropping here would be a sudden unexpected rally in the dollar, as a spinoff from a collapse in the euro occasioned by the deepening crisis in europe, with further panic funds flowing from plunging stockmarkets temporarily into the dollar and Treasuries, mainly because most investors can't think of anywhere better to park their funds (hint: try bear ETFs).
By Clive Maund
CliveMaund.com
For billing & subscription questions: subscriptions@clivemaund.com
© 2011 Clive Maund - The above represents the opinion and analysis of Mr. Maund, based on data available to him, at the time of writing. Mr. Maunds opinions are his own, and are not a recommendation or an offer to buy or sell securities. No responsibility can be accepted for losses that may result as a consequence of trading on the basis of this analysis.
Mr. Maund is an independent analyst who receives no compensation of any kind from any groups, individuals or corporations mentioned in his reports. As trading and investing in any financial markets may involve serious risk of loss, Mr. Maund recommends that you consult with a qualified investment advisor, one licensed by appropriate regulatory agencies in your legal jurisdiction and do your own due diligence and research when making any kind of a transaction with financial ramifications.
Clive Maund Archive |
© 2005-2022 http://www.MarketOracle.co.uk - The Market Oracle is a FREE Daily Financial Markets Analysis & Forecasting online publication.


