


Gold Extremely Dangerous Parabolic Curve as Speculators Build Massive Positions
Commodities / Gold and Silver 2011 Aug 22, 2011 - 11:51 AM GMTBy: Ned_W_Schmidt

 Near the end of any investment cycle a transfer of ownership normally occurs, from investors to speculators. The asset moves from strong hands to weak hands, from real ownership to fictional ownership in the market for contracts for future delivery. That usually set up conditions for the penalty phase, as those still bleeding from the Silver bear market fully understand.
As we learn from Japan, owners of physical Gold in all forms are aggressively liquidating. From "Tokyo struggles to keep pace with gold rush" by L. Whipp from Financial Times, 20 August,
"Japanese families are rushing to sell gold jewelry, sake cups and even teeth to cash in on surging gold prices. The stampede to sell gold is so intense that shops buying the precious metal are struggling to cope and are even having to turn some disappointed customers away."
"In the past week, Goldplaza, which buys and melts down gold for resale, has been handling about Y100m($1.32m) of gold every day - about 15 times its daily average in July. The craze began in earnest on August 11 . . ." [Emphasis added.]
At same time, speculators are building massive positions. CME has been reporting record open interest for options on Gold futures. At one point last week those speculative trading positions represented ~126 million ounces, or ~3,900 tonnes. That is indeed speculation of size, and that activity has been the driving force for creating a speculative bubble in $Gold, and the parabolic curve shown in the chart below. Left axis is dollars while the right axis is percentage of 1999 low, the beginning of this market move.
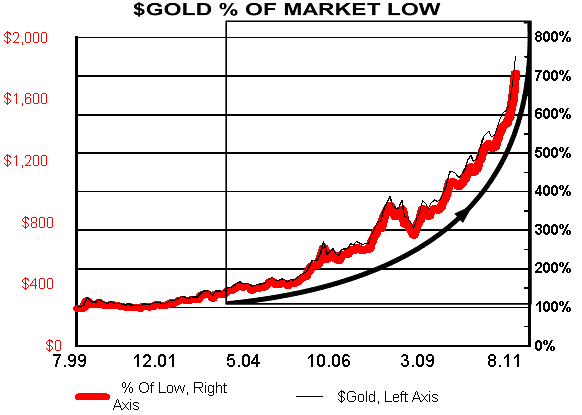
A parabolic curve is a formation that is extremely dangerous as it is inherently unstable. As price rises, the slope of the price line becomes steeper in defiance of financial gravity. Imagine throwing a ball into the air and it rises faster the further it rises. This curve suggests that as price rises demand is rising, a wholly unnatural state of events.
We know two things about parabolic formations.
One, they always end in pain. Two, we never know when they will end, due to the unnatural conditions for demand.
All this might not be so worrisome if $Gold were not so over valued relative to financial assets, as shown in the graph below.
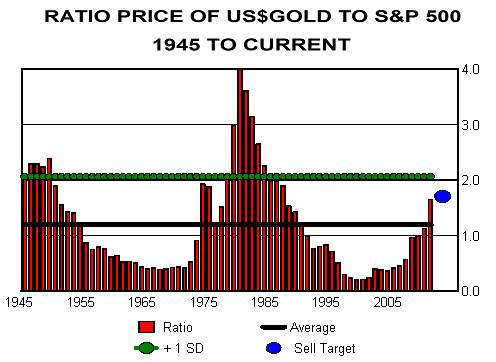
This graph is interesting as it allows us to answer "what if" questions. Take the nonsensical forecast of $5,000 Gold. That value translates into a ratio of ~4.5 in the graph above. Based on the data presented in that chart, the probability of that occurring is approaching zero.
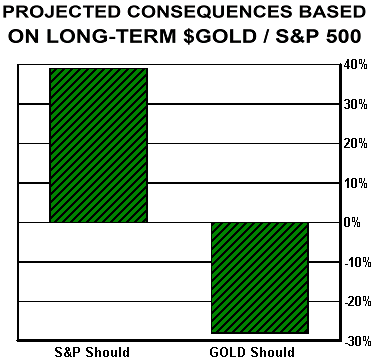
What if we assume that $Gold is priced correctly. What does that suggest for the U.S. stock market? Answer to that question is in the chart to the right. What if the stock market is now priced properly. What does that imply for $Gold? That is also in the chart. Reality will obviously be somewhere in between.
With Henny Penny now the chief investment strategist for the Street, remember that Foxy Loxy was the only winner, of a full meal of poultry.
Gold investors may want to just hold, despite the over valued condition and vulnerable pricing. Adding Rhodium to such portfolios makes sense for diversification purposes and exposure to growth in China and India. Another alternative is to add Chinese Renminbi denominated bank deposits.
Silver investors should be aggressively selling Silver. Rarely does a bear market give one a second chance to get out. Rhodium should be considered as an investment with proceeds from selling Silver. This situation is a real life version of old story of the farmer and mule, when he said, "That's twice."
Do not forget, the margin clerk has already spoke once. She will speak again, and arguing with a margin clerk is truly foolish.
By Ned W Schmidt CFA, CEBS
Copyright © 2011 Ned W. Schmidt - All Rights Reserved
GOLD THOUGHTS come from Ned W. Schmidt,CFA,CEBS, publisher of The Value View Gold Report , monthly, and Trading Thoughts , weekly. To receive copies of recent reports, go to www.valueviewgoldreport.com
Ned W Schmidt Archive |
© 2005-2022 http://www.MarketOracle.co.uk - The Market Oracle is a FREE Daily Financial Markets Analysis & Forecasting online publication.