


U.S. Household Debt Deleveraging Metrics Raise Worrisome Questions
Economics / US Debt Aug 26, 2011 - 01:54 AM GMTBy: Asha_Bangalore

 Household debt outstanding hit a peak of $13.9 trillion in the first quarter of 2008. This staggering amount of household debt was close to 100% of GDP of the nation (see Chart 1). Home mortgages and consumer credit make up household debt, with home mortgages accounting for roughly 75% of household debt.
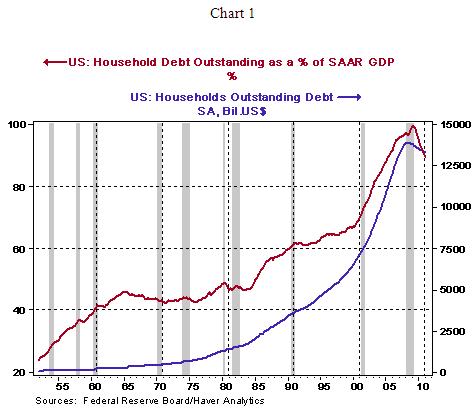
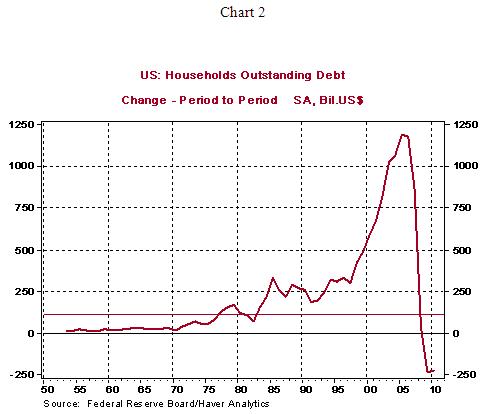
A large part of the sharp accumulation in debt has occurred since the second-half of the 1990s. The median increase in household borrowing per year during 1953-2010 is $114.7 billion (see horizontal line in Chart 2). There was a gradual upward trend in household borrowing which exceeded the historical median in 1980s and 1990s; the outsized increase occurred during the ten years ended 2008. In other words, the atypical accumulation of debt which exceeded historical norms was spread over a span of ten years.
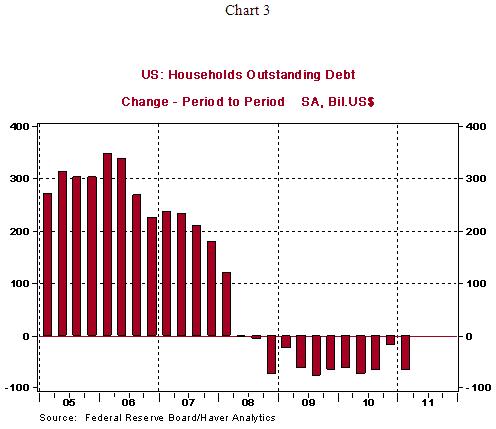
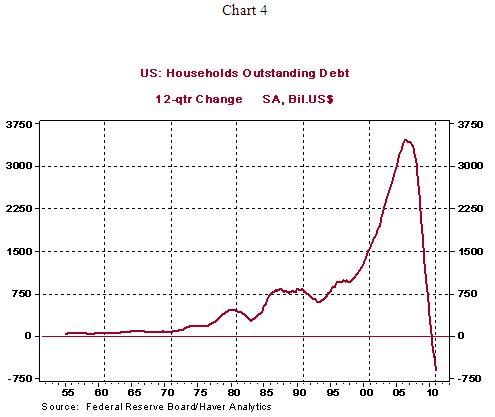
Narrowing the period of investigation to the last four years, households are not increasing their liabilities but household debt has shrunk in each of the twelve quarters ended 2011:Q1 (see Chart 3). Deleveraging is the process of reducing debt and borrowing less. The cumulative decline in household debt during the last twelve quarters amounts to $608.43 billion (see Chart 4). A reduction of household debt could be involuntary (charge-offs, tightening credit standards) or voluntary (consumers choosing to borrow less and paying off outstanding debt).
The bottom line is that a reduction of household borrowing implies a reduction in spending and therefore a lower GDP headline number. A New York Fed study has attempted to identify the nature and causes of household deleveraging and concludes that “observed deleveraging seems likely to have involved reductions in both the demand and supply of credit.” The conclusion suggests that policies to increase the demand and supply credit are necessary in the near term. More importantly, the duration to complete the process of deleveraging could be an extended period with significant adverse macroeconomic consequences.
Asha Bangalore — Senior Vice President and Economist
http://www.northerntrust.com
Asha Bangalore is Vice President and Economist at The Northern Trust Company, Chicago. Prior to joining the bank in 1994, she was Consultant to savings and loan institutions and commercial banks at Financial & Economic Strategies Corporation, Chicago.
Copyright © 2011 Asha Bangalore
The opinions expressed herein are those of the author and do not necessarily represent the views of The Northern Trust Company. The Northern Trust Company does not warrant the accuracy or completeness of information contained herein, such information is subject to change and is not intended to influence your investment decisions.
© 2005-2022 http://www.MarketOracle.co.uk - The Market Oracle is a FREE Daily Financial Markets Analysis & Forecasting online publication.