


Gold Blow Off May Have Arrived
Commodities / Gold and Silver 2011 Aug 28, 2011 - 01:05 PM GMTBy: Merv_Burak

Gold Blow Off May Have Arrived
 Boy, some of these moves are getting kind of scary. To keep your balance about things it might be very beneficial to watch the long term chart. It does not roller coaster like a short term one. On the other hand there may be just too much action missed between a short term and a long term trend.
GOLD
Way behind time so once again it’s just the facts. Maximum information with minimum time spent.
LONG TERM
Trend: Although it looks like the blow-off suggested here last week has arrived. Still, the long term trend has not changed. Gold remains above its long term positive sloping moving average line and above its long term up trend line (that lower channel support line shown here a couple of weeks back).
Strength: The long term momentum indicator remains in its positive zone but the action of early this past week has knocked some steam out of it. It is now below its negative sloping trigger line for the first early warning of possible trend change sometime ahead.
Volume: The volume indicator remains one strong long term indicator and remains above its positive sloping long term trigger line.
Despite a minor early warning from the momentum indicator the long term rating remains BULLISH at the Friday close.
INTERMEDIATE TERM
Trend: If I can easily draw three Accelerating FAN trend lines then I have the criteria for my blow-off period. The breaking of that third FAN trend line is the end of the blow-off trend and the end of the present bullish trend, intermediate term wise. Watch for the price to move within those last two FAN lines for a while but inevitably drop into the area between the first and second FAN trend lines. So much for “predicting”. On the Friday close gold remains above its intermediate term positive sloping moving average line so from the indicators the intermediate term trend is still on-going. The FAN line (blow-off) break is a very early reversal indicator.
Strength: The intermediate term momentum indicator entered its overbought zone and quickly backed off. It remains in its positive zone but below its negative sloping trigger line. This reversal of the momentum indicator back below its overbought line is another indicator of an end of trend for a while. Friday’s price reversal had very little effect on the momentum indicator, at least at this time.
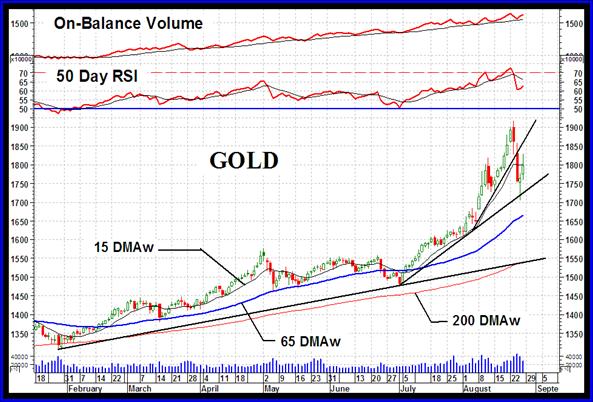
Volume: Still one of the strong indicators, the volume indicator has been consistently making new highs and remains above its positive sloping trigger line.
Despite the early reversal signal from the FAN lines and the momentum indicator the overall intermediate term indicators still give us a BULLISH rating at the Friday close. This bull is confirmed by the short term moving average line remaining above the intermediate term line.
SHORT TERM
Trend: The third FAN trend line may be assumed as a short term trend line. This trend line was broken on Wednesday and the price of gold remains below the line. On Wednesday the price of gold also closed below its short term moving average line turning the moving average line towards the down side. By Friday gold looked like it was back on the up move but closed on Friday just below its moving average line. The line itself has turned back to the up side on Friday.
Strength: On Wednesday the short term momentum indicator broke below its overbought line (it was basically in the overbought zone for a few weeks) and below support going back to early July. It remained in its positive zone, however, and is turning back to the up side but still below its negative trigger line.
Volume: The daily volume action is telling us a somewhat different story than the intermediate and long term volume indicators are telling us. With the price advance starting two weeks ago the volume has been pretty low. It started to improver at the top of the move peaking on the two down days. The advance on Thursday and Friday was once more on decreasing volume. Not the volume action one likes to see.
Putting it all together I cannot give the short term rating a bull or a bear rating. It is close to a bear but comes in as a – NEUTRAL rating, one level above a full bear. The very short term moving average line is confirming this neutrality. It is heading lower fast and is very, very close to moving below the short term line, but not quite yet. Possibly another day will do it.
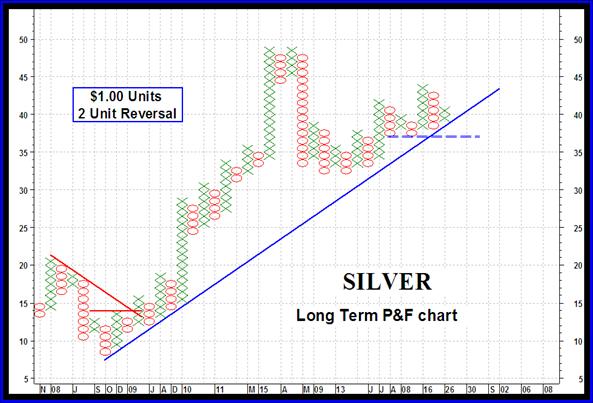
SILVER
Briefly, the P&F chart almost says it all. The long term bull remains in force but getting close to reversing. That would come on a move to the $37 level. However, a more important support would be at the $33 level.
Time limitations once more have caused me to cut the silver commentary short but suffice it to say that all three time periods are rated as BULLISH as of the Friday close.
PRECIOUS METALS STOCKS
Looking over the various major North American and Merv’s gold Indices they are still all (except for the Merv’s Qual-Gold Index) below their previous highs. It would take another good week for some of the major Indices to get back to new highs while it would require more than a week for the Merv’s Indices to do so.
What we have here is a clear indication, using the various Merv’s Indices that any upward movement in gold stocks lately has been in the largest company stocks and not the speculative or gambling variety. As mentioned previously, this is more of an indication that the majority of market players are not yet convinced that we are into a new major bull move. Once they are confident that we are in a new major bull move you will see them gravitate towards the more speculative stocks. These will then move and far out perform any gains that the quality stocks may have made to that point.
At this time it just might be more advantageous to sit back and wait for the speculatives to take flight. Of course, if you must be in the market the quality stocks just might be your investment hoping for gains with lower risk.
Merv’s Precious Metals Indices Table
Well, that’s it for this week. Comments are always welcome and should be addressed to mervburak@gmail.com.
By Merv Burak, CMT
Hudson Aero/Systems Inc.
Technical Information Group
for Merv's Precious Metals Central
For DAILY Uranium stock commentary and WEEKLY Uranium market update check out my new Technically Uranium with Merv blog at http://techuranium.blogspot.com .
During the day Merv practices his engineering profession as a Consulting Aerospace Engineer. Once the sun goes down and night descends upon the earth Merv dons his other hat as a Chartered Market Technician ( CMT ) and tries to decipher what's going on in the securities markets. As an underground surveyor in the gold mines of Canada 's Northwest Territories in his youth, Merv has a soft spot for the gold industry and has developed several Gold Indices reflecting different aspects of the industry. As a basically lazy individual Merv's driving focus is to KEEP IT SIMPLE .
To find out more about Merv's various Gold Indices and component stocks, please visit http://preciousmetalscentral.com . There you will find samples of the Indices and their component stocks plus other publications of interest to gold investors.
Before you invest, Always check your market timing with a Qualified Professional Market Technician
Merv Burak Archive |
© 2005-2022 http://www.MarketOracle.co.uk - The Market Oracle is a FREE Daily Financial Markets Analysis & Forecasting online publication.