Dow Transports Confirms the Stocks Bull Market - Dow Theory works !
Stock-Markets / Forecasts & Technical Analysis Feb 04, 2007 - 01:32 AM GMTBy: Clif_Droke
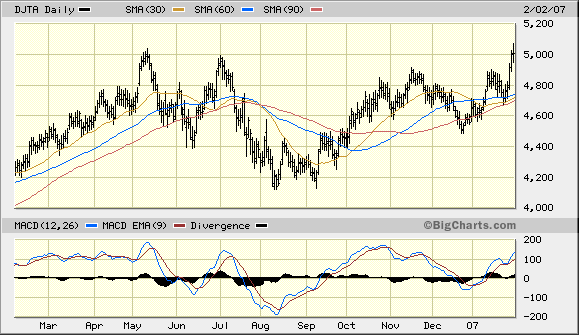
The first week of February was a memorable one for the stock market in many ways. From seeing the President make a rare appearance on the exchange floor of the NYSE, to the all-time high in the Dow Industrial index, to the breakouts in the small cap and mid cap sectors. But most memorable from a technical standpoint was the new all-time high in the Dow Jones Transportation Average (DJTA). That will be the focus of this commentary.
Every one of the eight major sectors that are part of the Group Movement Index (GMI) closed higher for the week ending Feb. 2, putting the GMI reading at a new high for the year as well as a 52-week high. The GMI is what is used to measure the strength or weakness behind the broad market, and it's arguably the simplest definition of whether stocks are in a bull market or a bear market.
What was especially gratifying to see this week were the breakouts in the Russell 2000 small cap index (RUT), the S&P 400 mid cap index (MID) and of course the Dow Jones Transportation Average (DJTA). Equally good to see was the Dow Jones Utilities Average (DJUA) turning up strongly this week and closing at just below its all-time high.
A bullish confirmation signal was generated in the Dow Jones Transportation Average on Friday. The DJTA finally closed above the 5,000 resistance level, which makes for an all-time high in this economically sensitive proxy. I've stated previously that a close above the 5,000 level would be a highly significant event, technically, and that it further holds the promise of further economic recovery as well as a continuation of the bull market in stocks.

From a Dow Theory standpoint, the Transportation index closing above 5,000 will cause a number of market technicians and investors to re-evaluate their previously bearish or non-committal stance on the future direction of stock prices (see “Ode to a Dow Theorist,” below). Those analysts that have stubbornly held to their bearish outlook, if they're intellectually honest, will at the very least question their reasons for remaining bearish. Once they openly admit that the new high in the DJTA is bullish from a Dow Theory perspective, the followers of these analysts will become more comfortable with the long side of stocks and this should translate into greater inflows into the market. A surge in trading volume followed by higher stock prices will then ensue.
Until now, the public's participation in the stock market has been very lackluster. For instance, the Rydex series of mutual funds measures participation in the stock market through its various bull and bear funds and by looking at the ratio of public assets in these funds you can gauge to what extent the public is invested in the market. Total assets in Rydex market funds is amazingly at a 3-year low despite the fact that the S&P 500 index is at a multi-year high, if you can believe that.

I read a quote from a prominent Dow Theorist who suggested that while Friday's closing high in the DJTA was technically bullish, it might prove to be a misleading signal. A reference was made to a time in the 1930s when the Dow Transports stubbornly refused to confirm the rally in the Industrials and when it finally did confirm the bull market ended. Could that happen this time around? In the stock market anything can happen but the odds are definitely against this. A classical Dow Theorist is motivated by his discipline in the Theory and will have to admit that a confirmation signal by the Transports of the strength in the Industrials is a bull market signal. Until the market actually reverses, he sticks to this discipline. There is no discretionary interpretation when it comes to pure Dow Theory -- it's strictly mechanical.
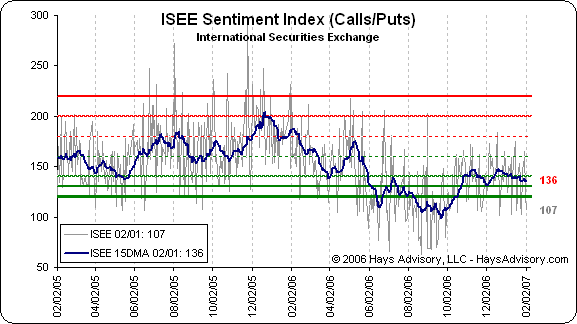
One reason why this bull market isn't likely to end anytime in the immediate future is because of the clear lack of public participation, or of anything approaching euphoria. Major bull markets always end with a final flourish where the public is heavily invested (usually leveraged to the hilt) and everyone and their hair stylist is excited about the “inevitability” of higher prices to come. Take a look at the put/call ratio chart below (courtesy Hays Advisory.com). Does this look like the public is hugely bullish on stocks?

Indeed, public participation in the stock market isn't nearly as widespread as it probably should be given the high levels of the major indices, but the new closing high in the DJTA will soon change all this if my guess is correct. The Dow Theory signal which has now been generated when will be a major shot across the bough for the bearish analysts and market advisors who chose to ignore the broad market's strength over the past couple of years. They won't be able to fall back on the excuse that the Dow Transportation Average is no longer confirming the Dow Industrials at new all-time highs.
Bottom line: The latest all-time high in the DJTA should mean we'll see more money from the retail investor finding its way into the stock market in coming weeks and months.
**********Ode to a Dow Theorist - O Russell, why be such a bear? with Dow Theory signals everywhere? The Transports have made an all-time high, and each day stocks scream to the sky! Bob Prechter I can understand, forever bearish: that's his brand. But from you we expect so much more, take a look at the charts, I implore! Just one more thing I'll say, forsooth: return, oh please, to the Theory's roots. **********
Internally, the broad market continues to be in fine shape as the NYSE net new highs/new lows continues to chalk up exceptionally bullish readings. On Thursday, Feb. 1, the number of NYSE stocks making new 52-week highs came in at 407. That's a monstrous 1-day “pop,” the biggest since Dec. 5, and while it suggests a market that is “overbought” in the very immediate term, it's also instructive of the excellent internal momentum this market still enjoys. That strong internal upside momentum continues to register in the HILMO indicators which measure the new highs/new lows on a rate of change basis. The 90-day, 120-day and 200-day HILMO indicators continue to surge higher and even the 30-day HILMO indicator, which had been in decline for most of the past month, has turned up in the past two days thanks to the surge in stocks making new highs.
As long as the broad market's internal momentum as defined by the rate of change in the number of net new highs keeps increasing, stock prices have higher to go in the foreseeable future. The fact that the Transportation industry stocks are finally joining the new highs list once again will only add to the market's internal strength.
By Clif Droke
www.clifdroke.com
Clif Droke is editor of the 3-times weekly Momentum Strategies Report which covers U.S. equities and forecasts individual stocks, short- and intermediate-term, using unique proprietary analytical methods and securities lending analysis. He is also the author of numerous books, including most recently "Turnaround Trading & Investing." For more information visit www.clifdroke.com
© 2005-2022 http://www.MarketOracle.co.uk - The Market Oracle is a FREE Daily Financial Markets Analysis & Forecasting online publication.


