


Stock Market Odds Favour More Declines Ahead
Stock-Markets / Stock Markets 2011 Sep 06, 2011 - 05:38 AM GMTBy: Andre_Gratian

 SPX: Very Long-term trend - The very-long-term cycles are down and, if they make their lows when expected, there will be another steep and prolonged decline into about 2014.
SPX: Intermediate trend - The bull market which started on March 2009 at 667 appears to have ended at 1370. It is unclear if the first intermediate decline of the new bear market is over.
Analysis of the short-term trend is done on a daily basis with the help of hourly charts. It is an important adjunct to the analysis of daily and weekly charts which discusses the course of longer market trends.
Market Overview
The second rally phase of the equity indices ended on Wednesday 8/31at 1231 on the SPX. Or is it the first? It depends on what kind of an analyst you talk to. Some EW experts believe that the decline back down to 1121 was a wave V failure from 1371, and that is when we started a corrective wave up. If it was not, and if we just ended a corrective wave IV, we are heading for a new low. We'll find out which is right over the next few weeks. What is certain is that the depth of Friday's retracement has nullified the possibility of the rally developing into an impulse wave for SPX.
In the last newsletter, I discussed the cycle configuration that lies ahead which will most likely determine the course of the market (until early October when the 3-yr cycle is scheduled to make its low). In spite of the current weakness, the trend may soon turn up, perhaps until 9/12 when the 14-15-wk cycle will make its high (assuming that it has not already done so). It will be between that date and early October that the market will be the most vulnerable to make a new low.
My crystal ball for early next week is prophesizing more weakness into about 1165-1158, and then the beginning of another near-term uptrend which could last until that cycle top on the 12th. That date is also interesting from an astrological view point. According to Raymond Merriman, the renowned Financial Astrologer, the second half of September has astrological signatures which could be adverse to the stock market. After early October, we should have a better idea of what kind of market trend we are in. In spite of the recent rally my long-term trend lead indicators have only consolidated and are still bearish. This, and the fact that the intermediate downtrend channel is still intact continue to give the long-term market trend a negative rating.
Let's illustrate the current market position with charts.
Chart analysis
It should not be a surprise that the rally found resistance where it did. The intersection of two channel lines provided some strong resistance which caused some hesitation in the SPX on Thursday. The coup de grace was administered by the jobs report on Friday, sending prices into another tail spin. This action puts an end to the budding uptrend which started at 1121 and pushed them back into a neutral state from which they will await their future fate. Should they be attracted by the 14-15-wk cycle top scheduled for the 12th, they will still have a chance to break out of the green channel but, as long as they are confined to the brown one, the SPX will remain in an intermediate downtrend.
It is not possible to make a reliable long-term forecast for the market until we see what kind of damage the bottoming 3-yr cycle will inflict, in early October. It is reasonable to assume that when that cycle turns up, it should provide some lift to prices for a few weeks. But if its low turns out to be the completion of wave V from 1370, and extends below 1101, the long-term destiny of the market will most likely be sealed, no matter what kind of rally is generated afterwards.
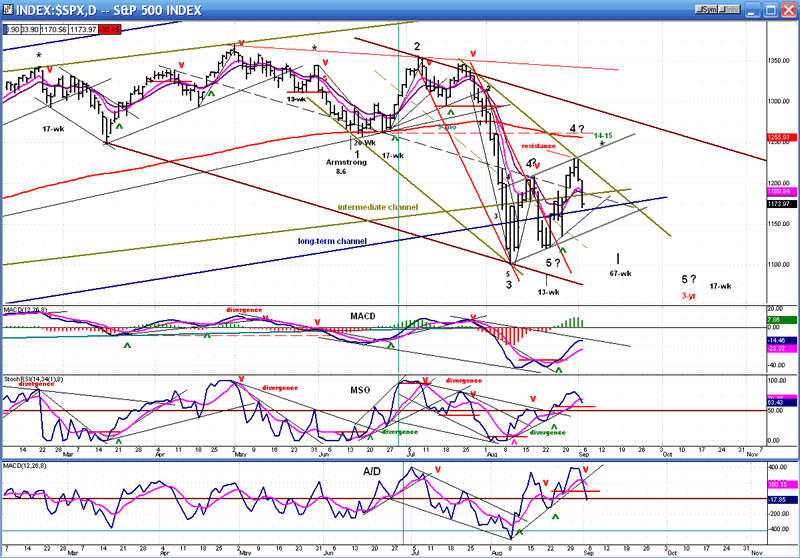
Since only the bottom indicator has given a short-term sell signal, it is premature to say that the index has already reversed and is ready to go lower.
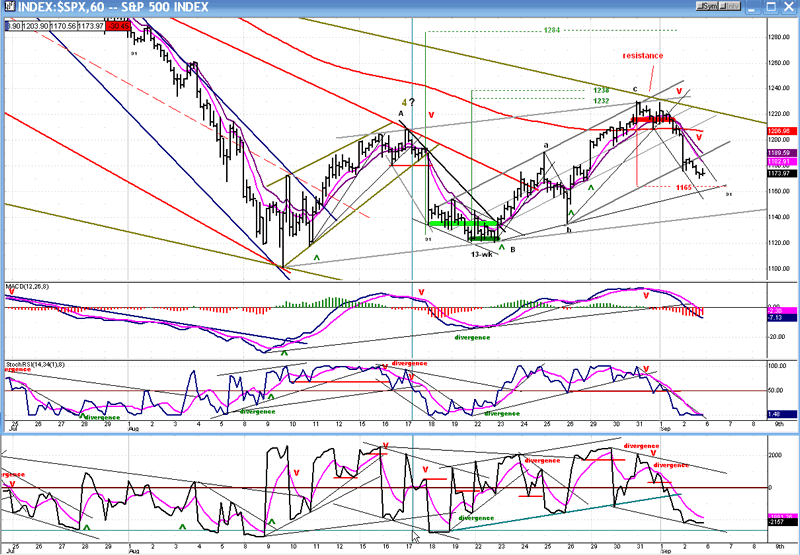
We can get a better feel for the near-term by looking at the Hourly Chart. In contrast to the daily chart indicators which have not given a decisive sell signal, the hourly ones did. They are not ready to turn up and give a near-term buy. If the cycle topping on 9/12 exerts enough upward pull, it can entice the index into another near-term uptrend. The base which was formed at the 1121 level has two distinct phases from which potential counts can be drawn. The small one, marked in dark green, provided targets of 1232-1238. The rally stopped at 1230.71. The larger base has a projection to 1284. Considering where the SPX closed on Friday -- especially if it drops lower before starting up - the odds that target will be reached are practically nil.
More likely, the base that is currently being formed - assuming that we turn up after touching 1165-1158 - will dictate the extent of the next near-term move. Since it is still a work in progress, we'll have to wait until it is complete. My short-term lead indicator is still bearish, so there is a good chance that we won't reverse from the level at which we closed. The hourly indicators also need to get into a better position before they can give a buy signal. This could take a day or two to achieve.
Cycles
I thought that the 14-15-wk high-to-high cycle (which has been very reliable for the past two years) had topped early, at 1231. It has done this occasionally in the past. But it could still make its high around 9/12. The best way to describe what lies ahead is by repeating what was said earlier.
"That (14-15-wk) cycle top is usually followed by a sharp decline and, in this case, will be assisted by the 67-wk cycle which is due for its low around 9/19. That should provide a bounce which will be cut short by the 3-yr cycle due in Oct. Then, the 17-wk cycle will be due mid-October.
If each of these cycles has even a moderate effect on the market, we are in for a volatile period. Beyond that, I am very interested in seeing the end result of this cyclic time frame, especially how it manifests itself on the P&F chart."
Breadth
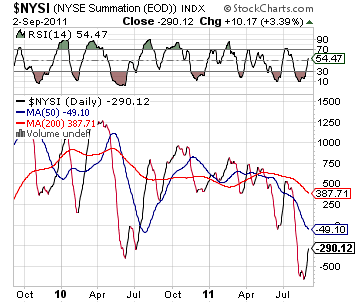
The NYSE Summation Index (courtesy of StockCharts.com) still looks very weak. Although it has rallied from its low, it is still negative and remains well below its 50 and 200-DMAs. The fact that it has dropped below the July low is an even bigger negative. This enhances the odds that we have started a bear market and that it's only a matter of time before the SPX makes a new low. We would have to see a tremendous improvement in the Summation Index before the odds shift to the positive side.
Sentiment
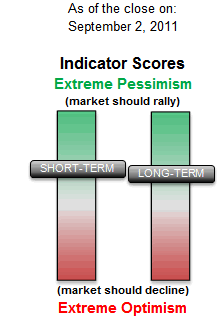
The readings of the long-term and short-term indices of the SentimenTrader (courtesy of same) are mildly positive. These readings are not telling us anything decisive at the moment.
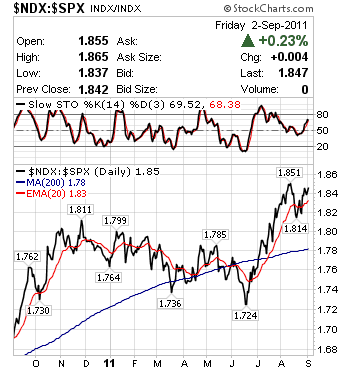
The next indicator still looks relatively strong and does not predict any immediate sustained weakness in the equity indices (unless it's "different" this time). As I pointed out last week, NDX is much stronger than SPX and it is conceivable that it could make a new high before the long-term decline resumes.
TLT is a good long-term indicator for the stock market. It moves inversely to it, charts well, and counts well. It has a short-term count of 114-115 which could be achieved Tuesday or Wednesday, and a long-term count to 126.
As you can see, the first top corresponded exactly with a parallel to the bottom trend line and acted as resistance to produce an immediate retracement. The next parallel will be in the vicinity of the short-term count over the next day or so, and if the market has a little more weakness on Tuesday, it could easily send TLT to that area for a short-term top, followed by a correction.
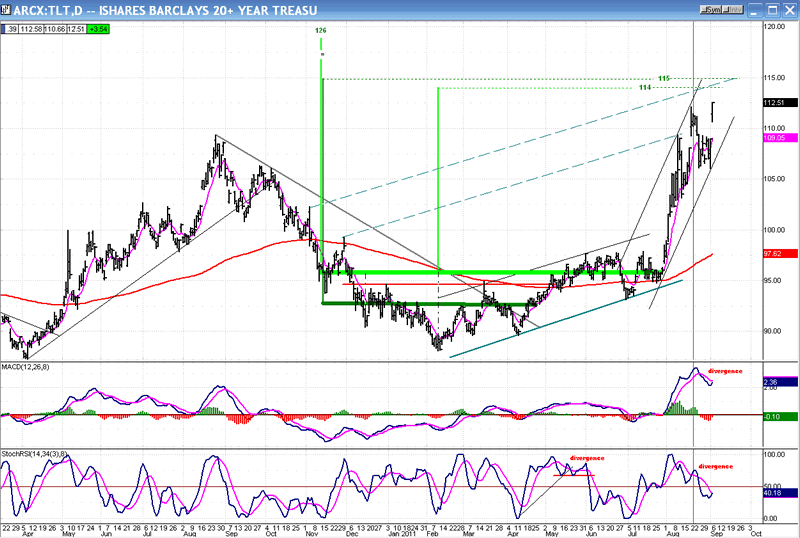
The count to 126, if it is reached, would coincide with a much lower low for the SPX, another reason to consider that we may have started a bear market.
Summary
Since last week's decline brought so much weakness, it has taken the wind out of the sails of any bullish forecast for the stock market over the next few weeks. Until proven otherwise, the odds still favor more long-term decline ahead.
The time frame between now and early October should bring some clarity to the current trend, especially if the SPX makes a new low by that date.
FREE TRIAL SUBSCRIPTON
If precision in market timing for all time frames is something which is important to you, you should consider a trial subscription to my service. It is free, and you will have four weeks to evaluate its worth.
For a FREE 4-week trial. Send an email to: ajg@cybertrails.com
For further subscription options, payment plans, and for important general information, I encourage you to visit my website at www.marketurningpoints.com. It contains summaries of my background, my investment and trading strategies and my unique method of intra-day communication with Market Turning Points subscribers.
By Andre Gratian
MarketTurningPoints.com
A market advisory service should be evaluated on the basis of its forecasting accuracy and cost. At $25.00 per month, this service is probably the best all-around value. Two areas of analysis that are unmatched anywhere else -- cycles (from 2.5-wk to 18-years and longer) and accurate, coordinated Point & Figure and Fibonacci projections -- are combined with other methodologies to bring you weekly reports and frequent daily updates.
“By the Law of Periodical Repetition, everything which has happened once must happen again, and again, and again -- and not capriciously, but at regular periods, and each thing in its own period, not another’s, and each obeying its own law … The same Nature which delights in periodical repetition in the sky is the Nature which orders the affairs of the earth. Let us not underrate the value of that hint.” -- Mark Twain
You may also want to visit the Market Turning Points website to familiarize yourself with my philosophy and strategy.www.marketurningpoints.com
Disclaimer - The above comments about the financial markets are based purely on what I consider to be sound technical analysis principles uncompromised by fundamental considerations. They represent my own opinion and are not meant to be construed as trading or investment advice, but are offered as an analytical point of view which might be of interest to those who follow stock market cycles and technical analysis.
Andre Gratian Archive |
© 2005-2022 http://www.MarketOracle.co.uk - The Market Oracle is a FREE Daily Financial Markets Analysis & Forecasting online publication.