


Gold and Silver Gearing Up for a Big Move
Commodities / Gold & Silver Dec 09, 2007 - 02:52 PM GMTBy: Merv_Burak

Something tells me there is a big surprise ahead. How big, which way and when, well that's what makes life interesting.
GOLD : LONG TERM - The long term usually changes very slowly so there is no use posting a long term chart each week. From the long term stand point nothing has changed from last week, or the week before. To summarize, the long term P&F chart is still bullish. Gold price is still well above its positive sloping moving average line. The long term momentum indicator is also still in its positive zone but giving us some warnings of the under performance of the strength in recent price action. All in all, the long term is still rated as BULLISH .
INTERMEDIATE TERM
No change from last week here either. Price still above its positive moving average line, and in fact continuing to bounce off the line. Momentum still positive but showing weakness. The volume indicator still not what one would like to see. All in all I can only continue with a NEUTRAL rating for another week.
SHORT TERM
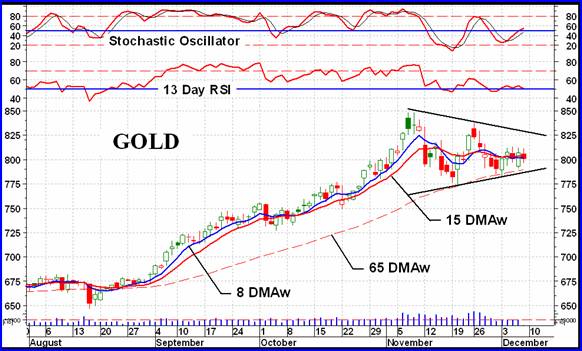
To get some interesting action we come to the short term chart. What immediately jumps out at you is the megaphone pattern that has developed lately. This pattern is often seen as a consolidation pattern whereby the price takes a rest to gather strength for the next move. It is seen as a bullish pattern following a bull move and often occurs mid-way in an overall trend. Therefore if one goes with the odds of this pattern one would be inclined to see an upside break ahead with a move that might take us to the $1000 level before the next rest. Is that what the indicators are telling us?
As mentioned in the long term section, we are still in a long term bull market so a continuation on the up side would be no great surprise. The intermediate term is so-so but still has not gone bearish. So, here too there is the potential of gathering strength once more for a good upside move. From the short term charts and indicators, this is where we would expect to first see a new move starting. As yet that has not happened but may soon. The price cannot stay inside that megaphone for much longer. The short and very short term moving average lines are bunched up with the price bouncing up and down through the lines with no discernible trend. The short term momentum indicator is basically neutral, hugging the neutral line, while the more aggressive Stochastic Oscillator has gone positive and continues to head higher. I would normally suggest that the levels to watch for the possible start of a new move would be $813 on the up side and $790 on the down side. However, the upper and lower boundaries of the megaphone pattern are very close to these levels and the breaking of their trend lines would be more important.
Although the megaphone after a bull move is considered as positive with an eventual upside break, I am still concerned at the recent price action. The price continues to bounce off its intermediate term moving average line BUT it hasn't gone anywhere. I would be inclined to think that if the price does not make a good upside move this week we might be in for a real bummer ahead, megaphone or no megaphone.
NORTH AMERICAN GOLD INDICES
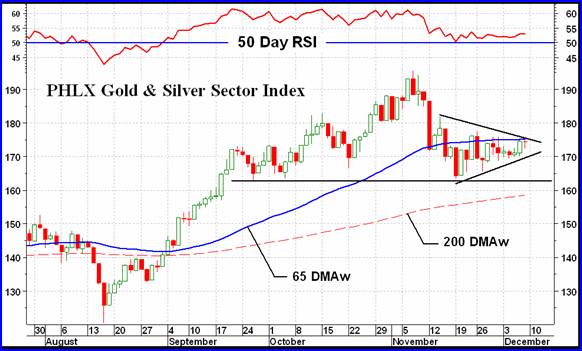
Two weeks ago I showed the AMEX Gold Miners Index with a potential developing bearish head and shoulder pattern. We see the same pattern in the PHLX Gold & Silver Sector Index (XAU). Also seen is a bearish megaphone pattern. Both, if breached, would project a move back to the August bottoming area.
The Index has been below its intermediate term moving average line for three weeks now and just can't seem to get the steam to break decisively above the line. The momentum indicator is showing this weakness although it is still inside its positive zone. Something's gotta give here. Although one might expect that the down side was the most probable I would not assume so as the market has a habit of ignoring the obvious.
MERV'S PRECIOUS METALS INDICES
There was a wide disparity between the best and worst performing Index this past week with the Merv's Qual-Silver Index gaining 6.4% and the Johannesburg Gold Index losing 7.4%. Most of the Indices, however, were in the 1% to 2% gain area. The three month rally in the Composite Index of Precious Metals Indices was just too steep to keep on going and the past few weeks has been the result. We are getting to the point where the reaction should halt and the Composite move sideways or else we might be in more trouble than we think. The next couple of weeks should give us a better idea if we are just in a bull market correction or the start of a new bear. Intermediate term most of the Indices are already in negative territory but there is still time for a turn around. Intermediate term going negative happens during a long bull market.
Once more gold made a better performance than did the Indices. Gold gained 3.9% on the week, better than the majority of the Indices and better than all the major ones. Since the Indices are often leading indicators versus the price of gold this lack of performance is a concern. However, concern or not, let's not jump the gun and let the Indices tell us what they ARE doing and not assume what they SHOULD be doing.
MERV'S GOLD & SILVER 160 INDEX
The performance of the overall universe of 160 stocks was basically bland. With a gain of only 0.2% we can say it was a neutral week for the overall group. The winners and losers showed a little better upside performance but not enough to get excited about. There were 87 winners (54%) and 70 losers (44%). As for the summation of individual stock ratings, they moved a little towards the positive but again, not enough to get all excited about. The basic ratings stayed the same except for the long term which moved from a neutral overall rating to a very slightly BULLISH rating. The short and intermediate term ratings both remained in the BEARISH camp.
As for the charts and indicators, nothing has changed from last week and both the intermediate and long term are still rated as BEARISH .
There were no spectacular movers this week as there was last week. In fact, there were only two that made it into the 20% range and both were on the down side.
MERV'S QUAL-GOLD INDEX : MERV'S SPEC-GOLD INDEX : MERV'S GAMB-GOLD INDEX
There was no discernable trend in the performances of the three sector Indices this week. The middle Index, the Spec-Gold Index, had the best gain at 3.2% while the highest quality Qual-Gold Index had the next best at 2.2% and the Gamb-Gold Index trailing behind with a loss of 0.1%. The winners and losers for each Index confirmed such performance with the Spec-Gold having 77% gainers, the Qual-Gold having 67% gainers and the Gamb-Gold having only 53% gainers.
The summation of individual stock ratings moved towards the positive for all Indices/time periods except for the intermediate term Gamb-Gold rating, which moved towards the negative. The following are the results of such summations.
Qual-Gold Index: Short term BEAR 60%, intermediate term BULL 50%, and long term BULL 82%.
Spec-Gold Index: Short term BEAR 57%, intermediate term BEAR 60% and long term NEUTRAL with neither bear nor bull in control.
Gamb-Gold Index: Short term BEAR 58%, intermediate term NEUTRAL and long term BULL 80%.
As for the summation of individual stock ratings, two of the ratings have been upgraded during the week. The intermediate term Qual-Gold rating has been upgraded from a bearish rating to – NEUTRAL while the long term Spec-Gold rating has been upgraded from a bearish rating to BULLISH . The intermediate term Spec-Gold rating remains as BEARISH while all the rest remain as BULLISH .
SILVER
Well, silver out performed gold this week with a 3.9% gain versus gold's 1.3% gain. That pushed the Qual-Gold Index to become the best performer of the week but did nothing for the Spec-Gold Index.
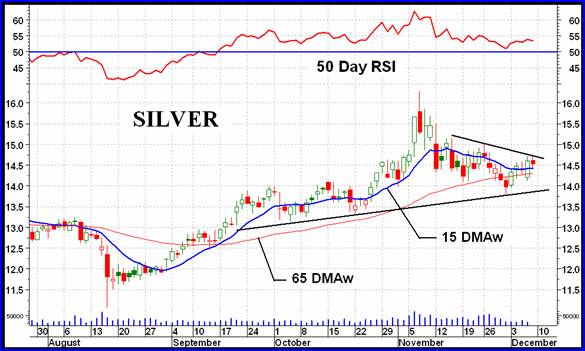
We see a head and shoulder pattern in the daily trading chart of silver. However, in my opinion this is a weak pattern. I usually like to see the momentum indicator giving a negative divergence warning at the time of the head formation. This would tell us of the weakening strength of the move. We have no such warning this time so although we have the pattern the odds of it becoming true are reduced. The action is, however, weak with very low volume accompanying the upside action during the week. For now let's see if the price will break through that short term down trend line or if the action will break below the H&S neckline. Either break should tell us the direction for the coming days or weeks.
MERV'S QUAL-SILVER INDEX : MERV'S SPEC-SILVER INDEX
It's interesting that when you look at the performance of the Merv's and North American Indices the two Silver Indices were at both the top and bottom. The Qual-Silver gained 6.4% as the best performing Index while the Spec-Silver lost 1.2% as the worst performer. As for winners and losers, the Qual Index has all winners, 100%, while the Spec Index had only 44% winners and 56% losers. As one might imagine the summation of individual stock ratings moved towards the positive for all Qual-Silver time periods. The short term is now into a BULL with 65% while the intermediate and long term improved their BULL rating to 70% and 80% respectively. As for the Spec-Silver Index, the short and intermediate term ratings improved their number a little without changing the rating. Both are still in the BEAR category with 78% and 62% respectively. As for the long term it decreased its number going into the BEAR category with 52% (from a previous neutral).
As for the charts and indicators, what they give us are two complete opposites. The Qual-Silver Index ends up with a BULLISH rating for the long and intermediate term while the Spec-Silver Index ends up with a BEARISH rating for the two time periods.
Merv's Precious Metals Indices Table
Well, that's it for another week.
By Merv Burak, CMT
Hudson Aero/Systems Inc.
Technical Information Group
for Merv's Precious Metals Central
Web: www.themarkettraders.com
e-mail: merv@themarkettraders.com
Before you invest, Always check your market timing with a Qualified Professional Market Technician
For DAILY Uranium stock commentary and WEEKLY Uranium market update check out my new Technically Uranium with Merv blog at www.techuranium.blogspot.com .
During the day Merv practices his engineering profession as a Consulting Aerospace Engineer. Once the sun goes down and night descends upon the earth Merv dons his other hat as a Chartered Market Technician ( CMT ) and tries to decipher what's going on in the securities markets. As an underground surveyor in the gold mines of Canada 's Northwest Territories in his youth, Merv has a soft spot for the gold industry and has developed several Gold Indices reflecting different aspects of the industry. As a basically lazy individual Merv's driving focus is to KEEP IT SIMPLE .
To find out more about Merv's various Gold Indices and component stocks, please visit www.themarkettraders.com and click on Merv's Precious Metals Central . There you will find samples of the Indices and their component stocks plus other publications of interest to gold investors. While at the themarkettraders.com web site please take the time to check out the Energy Central site and the various Merv's Energy Tables for the most comprehensive survey of energy stocks on the internet. Before you invest, Always check your market timing with a Qualified Professional Market Technician
Merv Burak Archive |
© 2005-2022 http://www.MarketOracle.co.uk - The Market Oracle is a FREE Daily Financial Markets Analysis & Forecasting online publication.