


Gold Fails to Hold New High, Watch out Below?
Commodities / Gold and Silver 2011 Sep 11, 2011 - 11:30 AM GMTBy: Merv_Burak

 Gold tried for new highs this past week but although it made it very slightly on an intra-day basis it still closed lower. By week’s end it seems to be rallying again but the momentum remains weak. Watch out below?
GOLD
LONG TERM
With the run-up during July and August gold has set itself up far above its long term indicators. Although it might turn downward from the other time periods perspective it does not look like gold will turn bearish from a long term perspective for some time yet.
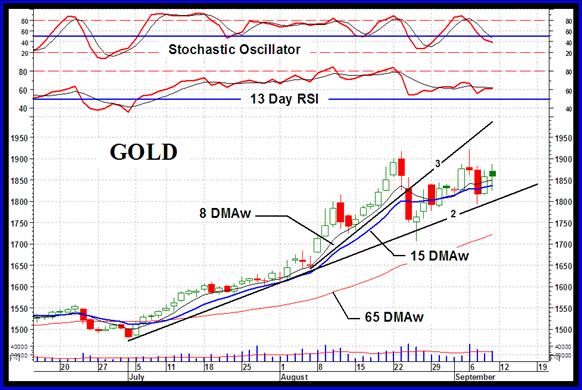
Trend: Gold has been moving upwards in a well defined channel since its low of 2008. Only in August has it broken from the channel, on the up side. This looks more like a blow-off move rather than a new more aggressive bull move. Unless the world is going to hell in a hand basket we will probably not see any new highs for some time, or if new highs do appear they are expected to be short lived. Any reaction from here is expected to be more of an intermediate term reaction rather than a long term reversal of trend, but let the indicators determine that event if it should come.
Gold remains well above its positive sloping moving average line and is expected to remain so for some time yet.
Strength: The July/August bull move had very good momentum behind it to the point of giving us the highest long term momentum readings since mid-2006. Unfortunately, the September try for new highs was on very much reduced strength and the price reacted. The long term momentum indicator remains in its positive zone but just slightly below my trigger line. The trigger is also sloping downward suggesting the strength of the price move continues to diminish.
Volume: The volume indicator turned to the up side in early 2008 and has basically been in an up trend since. It’s trigger line has remained in a positive slope throughout although the indicator crossed below the trigger on a few occasions. It remains above its positive trigger line at this time and did make a new high on Tuesday.
As of the Friday close the long term rating remains BULLISH.
INTERMEDIATE TERM
The short term chart in the next section shows the second and third FAN trend lines from an accelerating FAN trend. As mentioned previously, the breaking of that third FAN trend line was the end of the trend (blow-off stage). The action of gold has remained within the confines of the second and third FAN trend lines as expected. Also expected is an eventual move below that second FAN trend line towards lower levels. That should come very soon. In the mean time the intermediate term rating remains positive per the indicators.
Trend: That second FAN trend line could also be considered as an intermediate term up trend line with gold remaining above the line. Gold is also above its positive sloping intermediate term moving average line.
Strength: The intermediate term momentum indicator moved into its overbought zone three weeks ago and quickly reversed back below the zone. It has remained below and looking weaker. Although the indicator remains in its positive zone it also remains below its negative trigger line.
Volume: The volume indicator had breached its intermediate term trigger line earlier in the week but ended the week back above the trigger. The trigger itself is still sloping upwards although not aggressively so.
All in all as of the Friday close the intermediate term rating remains BULLISH. This bull is confirmed by the short term moving average line remaining above the intermediate term line.
SHORT TERM
While the long and intermediate term action remains pretty static as far as ultimate ratings are concerned the short term seems to be in play both on the up side and the down side. Today, it seems to be more on the up side.
Trend: Gold remains within the confines of the second and third FAN trend lines. It is also bouncing above and below its short term moving average line. At the Friday close it ended above the line and the line slope remains pointing upwards.
Strength: The short term momentum indicator remains above its neutral line where it has been since early July. However, it is slightly below a still downward sloping trigger line. The move this past week by gold into new intra-day highs was met be an ever weakening momentum so we might call that a negative divergence warning.
Volume: The daily volume remains weak and the up price days seem to be on lower than normal volume action. At the Friday close the daily volume was below its short term average volume.
On the short term, at the Friday close, the rating remains BULLISH. This is still confirmed by the very short term moving average line moving above the short term line.
As for the immediate direction of least resistance, the flip of the coin suggests a lateral trend remaining within the FAN trend lines for a little bit longer.
SILVER
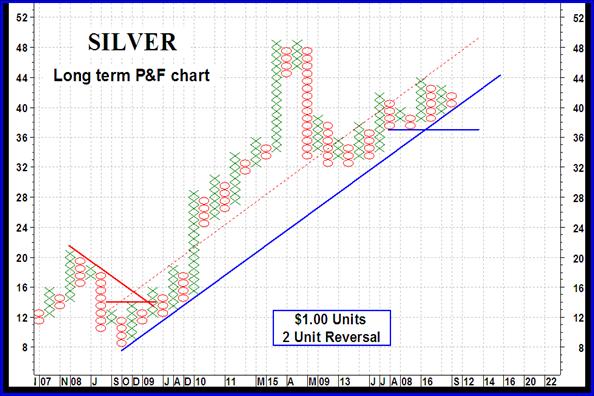
The long term silver P&F chart remains bullish but the reversal level is now being moved higher. A move to the $37 level would mark a reversal on this P&F chart. Such a reversal would project a move to the $28 level, but let’s not get ahead of ourselves.
LONG TERM
The P&F chart may say one thing but let’s see what the indicators are telling us as to the present position of silver.
Trend: Silver price remains above its positive sloping long term moving average line.
Strength: Since the plunge in early May the long term momentum indicator has been moving sideways with very little change in strength. It has remained at a strength level of 55% give or take 2% since the initial plunge. There is no immediate sign of that changing any time soon. The momentum remains in its positive zone oscillating above and below its trigger line. At the Friday close it ended the day just below the trigger line and the line is sloping downward.
Volume: The volume indicator is moving very slowly higher and remains above its positive sloping trigger line.
At the Friday close the long term rating for silver remains BULLISH.
INTERMEDIATE TERM
Trend: From the intermediate term standpoint silver has been trapped in a shallow up trending channel since its late June lows. It is presently in the lower half of the channel but still above its lower up trend line. Silver closed on Friday above its positive sloping intermediate term moving average line.
Strength: Although the intermediate term momentum has been moving in a lateral direction similar to the long term momentum it has been somewhat more volatile as far as its upper and lower limits are concerned. In any way it has remained in its positive zone since early July but has, at the Friday close, dropped below its now negative sloping trigger line.
Volume: The volume indicator is starting to lose luster as far as the intermediate term is concerned. It is sitting just above its trigger line although the trigger remains positive.
For the intermediate term the silver rating at the Friday close remains BULLISH. This is confirmed by the short term moving average remaining above the intermediate term average.
SHORT TERM
On the short term things are not quite as peachy.
Trend: Silver is sitting right on top of its short term moving average line although the line itself is still very, very slightly positive in slope.
Momentum: The short term momentum indicator is still in its positive zone but may not stay there much longer. It has dropped below its trigger line and the trigger is heading downwards.
Volume: The daily volume action is relatively very low suggesting a decided lack of interest by the speculators who move prices. This may be a precursor to more downside action to attract the buyers.
On the short term the silver rating at the Friday close must be classified as NEUTRAL but heading lower. The very short term moving average line is still above the short term line suggesting that the bear has not yet been confirmed (which I guess is what the neutral rating also says).
Merv’s Precious Metals Indices Table
Well, that’s it for this week. Comments are always welcome and should be addressed to mervburak@gmail.com.
By Merv Burak, CMT
Hudson Aero/Systems Inc.
Technical Information Group
for Merv's Precious Metals Central
For DAILY Uranium stock commentary and WEEKLY Uranium market update check out my new Technically Uranium with Merv blog at http://techuranium.blogspot.com .
During the day Merv practices his engineering profession as a Consulting Aerospace Engineer. Once the sun goes down and night descends upon the earth Merv dons his other hat as a Chartered Market Technician ( CMT ) and tries to decipher what's going on in the securities markets. As an underground surveyor in the gold mines of Canada 's Northwest Territories in his youth, Merv has a soft spot for the gold industry and has developed several Gold Indices reflecting different aspects of the industry. As a basically lazy individual Merv's driving focus is to KEEP IT SIMPLE .
To find out more about Merv's various Gold Indices and component stocks, please visit http://preciousmetalscentral.com . There you will find samples of the Indices and their component stocks plus other publications of interest to gold investors.
Before you invest, Always check your market timing with a Qualified Professional Market Technician
Merv Burak Archive |
© 2005-2022 http://www.MarketOracle.co.uk - The Market Oracle is a FREE Daily Financial Markets Analysis & Forecasting online publication.