


What Social Mood Is Saying About the Stock Market
Stock-Markets / Stock Markets 2011 Sep 12, 2011 - 03:25 AM GMTBy: J_W_Jones

 Social mood is absolutely horrible right now. In my experience as a trader I do not recall a similar time frame in my life. Social mood has deteriorated to the point that it would not surprise me to see two grown men come to blows over a fantasy football draft. Oh wait, that happens every year!
In all seriousness, the world seems to be getting more dangerous every day. At this point I think even Mother Earth is socially frustrated as she wreaks havoc all over the world. Earthquakes, droughts, wild fires, famine, hurricanes and the list goes on and on. Politics are as divisive as any time in recent history and the rhetoric is just excruciating. So what does all of this negativity mean for financial markets?
It means that every article is under the microscope and anyone who opposes the view of the writer or speaker reacts with vitriolic commentary that many could conceivable call “hate mail.” People are hurting badly from both an economic and social perspective. You can bet that the current social malaise is going to impact financial markets and I would argue that it already has.
August was a poor month for most investors as the equity indices took a nosedive and sold off sharply. I warned members of my service incessantly to reduce risk ahead of the selloff and I sat in cash as markets were crushed. I received countless emails telling me I was essentially an idiot and Mr. Market was going to kick my backside. Initially they were right, but time proved my analysis prescient.
August was the single best month I have had for members at my service at OptionsTradingSignals.com. I only placed 3 trades in the entire month. Two SPY trades that were directionally biased to the long side and both produced outstanding profits. I also utilized a time decay strategy for a GLD position which worked out quite well. By the end of the month of August all 3 positions were closed and the gross gain based on maximum risk was over 100%. If a trader risked a maximum of $1,000 on each trade taken at the end of August the trader's account would have grown to around $2,000.
One of the guys I trade with got his ETF newsletter subscribers in at the bottom for a quick 4.5% bounce then shorted a week later using the SDS inverse etf to catching another 6% on the way down… So as you can see there are many ways to play market volatility
So what is going to happen next? The funny thing is not a lot has changed since my most recent article I posted back on August 28th. The following chart below still holds sway in terms of overhead resistance for the S&P 500:
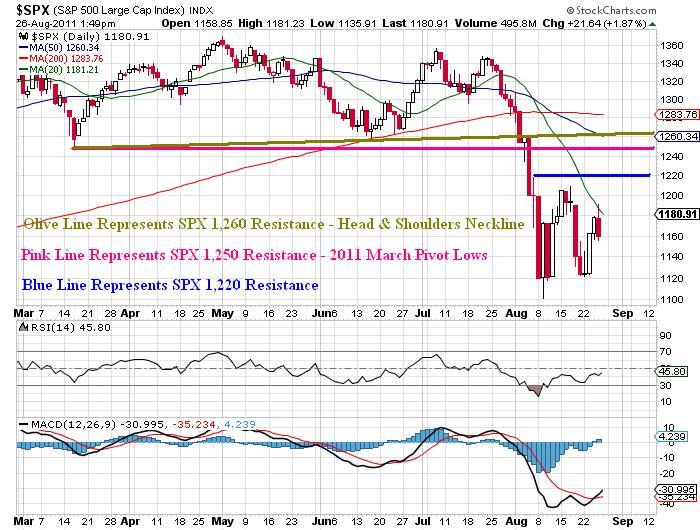
In the same article I wrote the following statement:
“In the short to intermediate term, I believe we will see higher prices and a test of the key S&P 1,220 area or possibly a re-test of the key S&P 1,250 price level which corresponds with the March 2011 pivot lows. Additional resistance would come in around the 1,260 – 1.270 area which marks the neckline of the recent head and shoulders pattern which triggered the selloff in the S&P 500.”
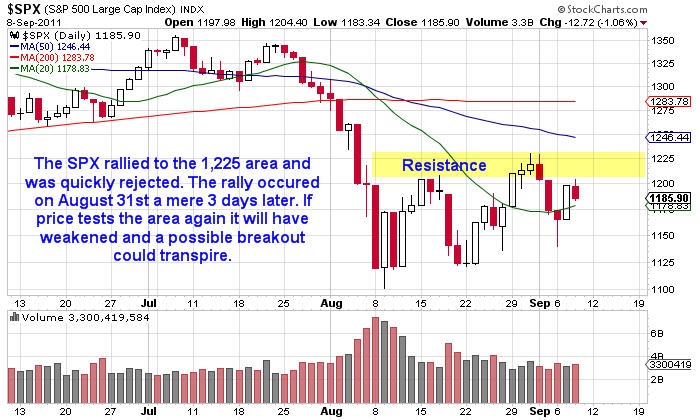
Unlike many financial writers, I am a trader first and a writer second. I put my money where my mouth was and took a trade that got long based on the analysis I provided readers and members of my service. The following price chart illustrates the resistance level that held the S&P 500's first attempt to rally:
Those of you who do not believe that technical analysis works are wrong. While technical analysis should not be the only metric used to enter or exit positions, basic support and resistance levels can help traders take profits at appropriate times. In addition, laying out longer term support and resistance levels give traders the ability to place trades in a step or tiered system. Essentially, once a trader has identified support and resistance levels the trade can sell into resistance and add to his/her position near support. Technical analysis provides great exit and entry points for astute traders.
My viewpoint of the S&P 500 has not changed much since August 28th. I think we will continue to see choppy price action and a retest of the 1,220 level is likely, if not probable. If the SPX 1,220 price level gives way to higher prices a retest of the March pivot lows will be the next resistance point. The March pivot lows correspond directly with the SPX 1,250 price level and the 50 period moving average will be flirting nearby.
If prices continue to work higher the neckline of the head and shoulders pattern which produced the selloff in early August will be tested. The point that readers should take from this is that overhead resistance is extreme at this point. The following chart below illustrates the key resistance levels and the current rising channel on the daily chart.
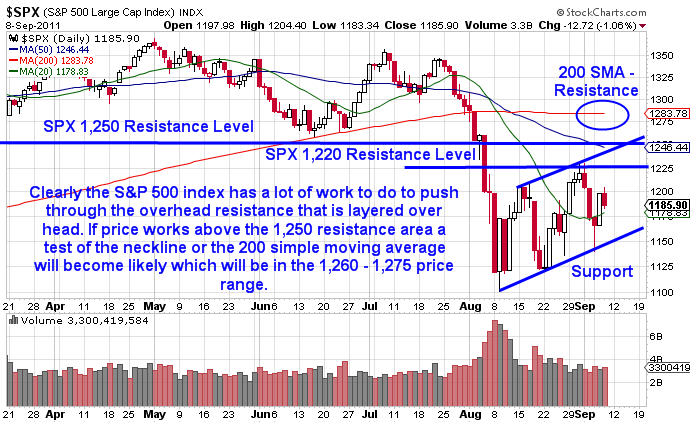
While it may sound a bit confusing, higher prices in the near term will likely be bearish in the intermediate to longer term. In my previous article, I commented that I believed we had likely entered the next phase of the bear market and I still believe that. At this point in time I am just waiting for the price action to confirm my suspicions.
The first confirmation that the bear market will have returned would be a lower high on the daily and weekly time frame. The final confirmation would occur if prices rollover and breakdown below the August lows. If the August lows are taken out on a daily and/or weekly close an all-out rush to the exits is possible. Ultimately I believe that risk is increasing to the downside if prices keep working higher.
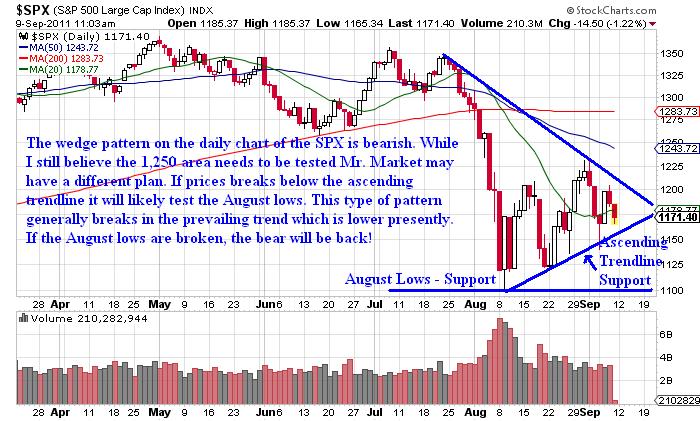
Right now I'm expecting higher prices unless the ascending trendline of the channel is penetrated on a daily or weekly close. Otherwise, the bullish churn higher will continue. The chart below illustrates the key support levels that if broken could lead to additional downside.
I am expecting to see a test of the 1,250 area before the end of September. It is entirely possible to see a test of the neckline as well which would help suck in retail investors who are scared they are going to miss the move back up. A rally that is contained around the SPX 1,250 – 1,275 price levels could result in a sharp selloff.
All eyes are on the key 1,220 price level to the upside and the August lows. A breakout in either direction could result in a big move. If I had to guess, the thrust higher will end in late September or the early part of October, but I would be remiss not to mention that one headline out of Europe could derail my entire thesis.
The two single largest threats to a stock market advance stem from Europe. The European sovereign debt crisis is one key issue that could alter the marketplace by its own merit. A more silent concern for U.S. equity markets is the impact the European situation will have on the U.S. Dollar.
Subscribers of OTS pocketed over 100% return in August alone!
Join Now at http://www.optionstradingsignals.com/specials/index.php for a 24 hour 66% off coupon.
J.W. Jones is an independent options trader using multiple forms of analysis to guide his option trading strategies. Jones has an extensive background in portfolio analysis and analytics as well as risk analysis. J.W. strives to reach traders that are missing opportunities trading options and commits to writing content which is not only educational, but entertaining as well. Regular readers will develop the knowledge and skills to trade options competently over time. Jones focuses on writing spreads in situations where risk is clearly defined and high potential returns can be realized.
This article is intended solely for information purposes. The opinions are those of the author only. Please conduct further research and consult your financial advisor before making any investment/trading decision. No responsibility can be accepted for losses that may result as a consequence of trading on the basis of this analysis.
© 2005-2022 http://www.MarketOracle.co.uk - The Market Oracle is a FREE Daily Financial Markets Analysis & Forecasting online publication.