


Stock Market VIX Fact That There is No Fear is to be Feared
Stock-Markets / Financial Markets 2011 Sep 20, 2011 - 02:37 PM GMTBy: Capital3X

 There is very little fear in the markets at this point of time. Clear price action, option market activity and VIX all indicate to a relaxed market.
VIX Charts: DAILY
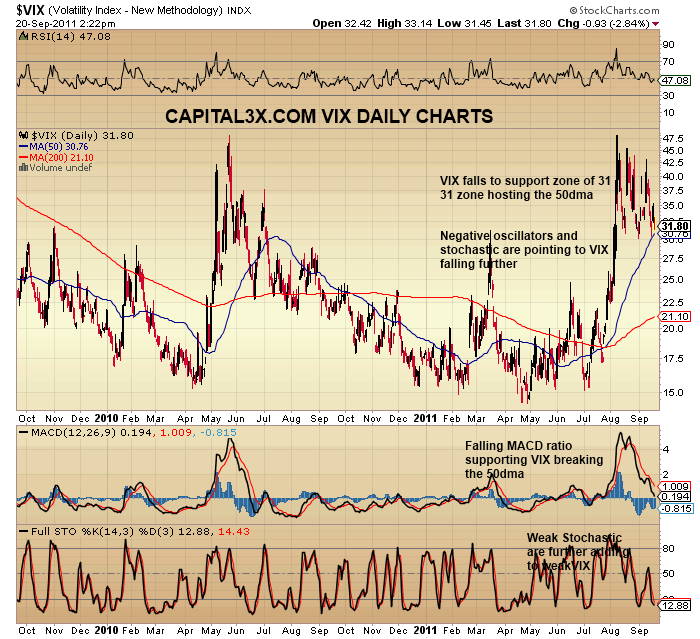
All indicators on the VIX charts point to a fall in VIX back to high 20s. Negative Oscillators and weak stochastic are pointing to further falls in VIX.
Under normal and rational conditions, one would have taken theis at face value but not at a time like this. We are going to look at some other inter market relations to understand the developing trends.
The aussie continues to show the way. Even though SP500 still is not ready to give way, given that SPY has never rallied without the aussie assisting it, we will look to the AUD/USD pair to show guidance.
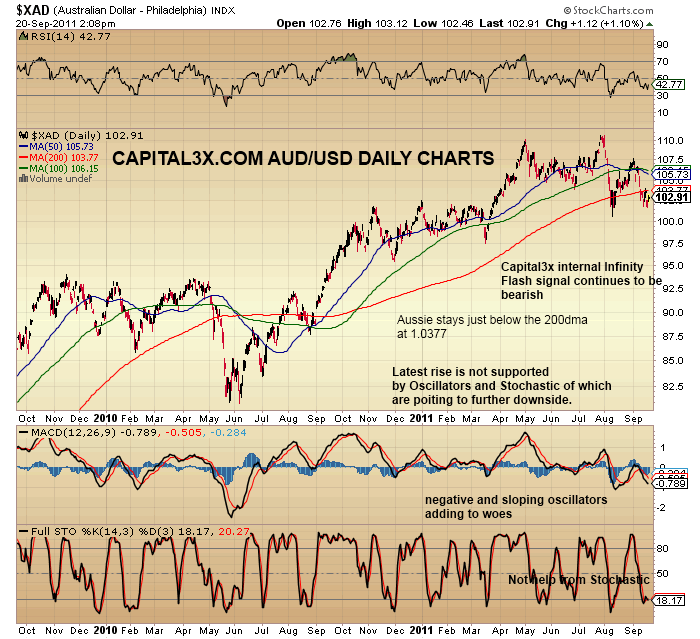
The AUD/USD is now running close to the 200dma which was broken last week and has not bee regained since. The 200 dma comes in at 1.0377 vs 1.0396 last week. The Oscillators are negative with a trend down while daily stochastic are weak below 20. Even with RISK ON trade in SPY, we are yet to see any kind meaningful rally in AUD/USD.
Candle Charts: AUD/USD daily
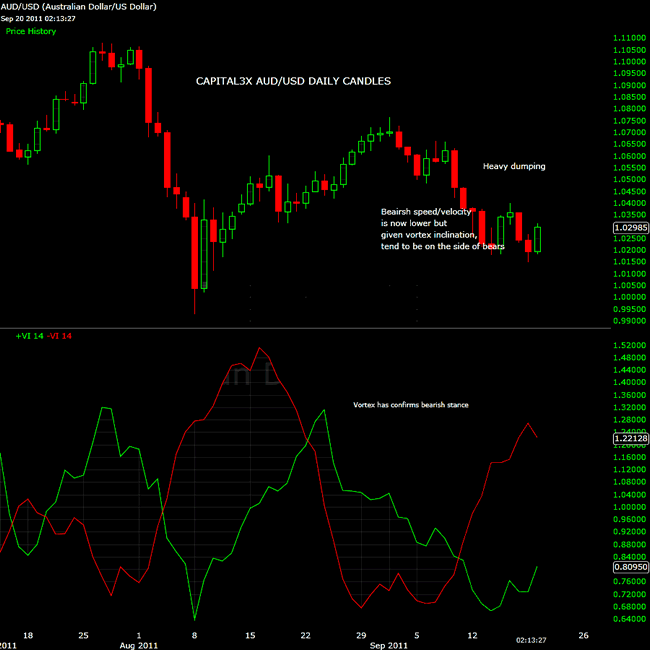
The vortex indicator is still bearish and with no signs of any kind of close of gap, we believe the bearishness in the Aussie is hear to stay.
An important chart to look at is the GLD:TLT charts which too are now at the point of a major and massive selloff.
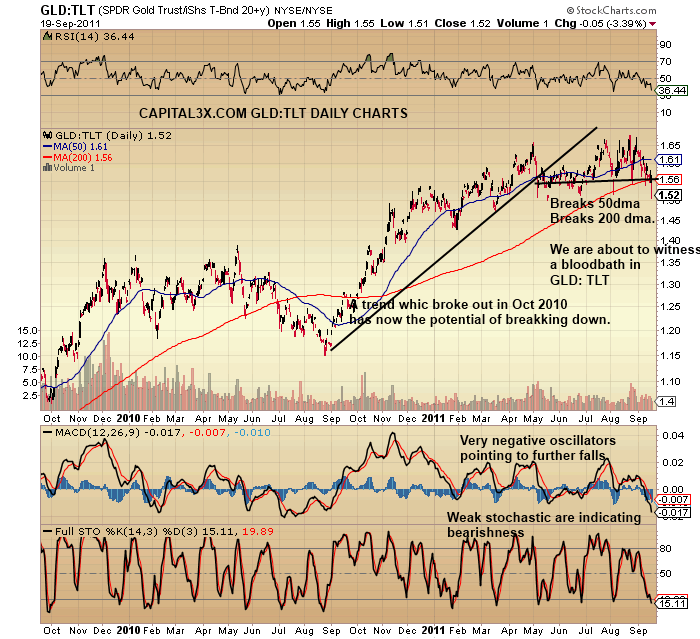
Any break of the trend will accelerate Bond market flows and therefore increase selloff in Gold assets. The positive flows into Treasury will put pressure on SPY as equity sell off begins in earnest. We have explained this in our premium article where we have looked at GLD:SPY and GLD:TLT charts.
Charts from Treasury market continue to lead us to believe that extreme compression in yield will ultimately have its disastrous effects on equity investor.
Further yield on 10Y UST, has now broken below 1.97% which is now an all time low. The 20 year bull run in treasury continues its relentless rise.
20 year trend continues
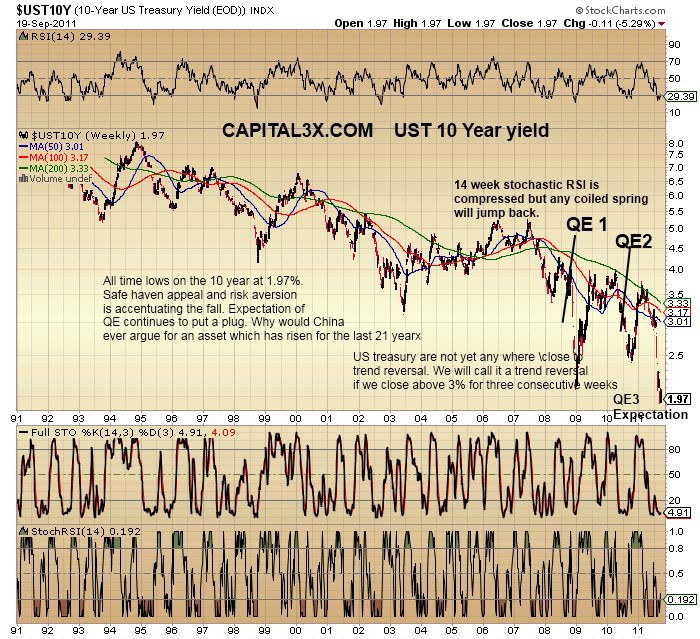
QE1 and QE2 had unnaturally pulled down the yield by over 15% as banks stocked up in expectation of QE. We see a massive compression in yield since August 2011, the first time, there was market rumors about Bernanke moves to further easing. The yield compression in August/September 2011 has been larger than the first and second QE operations giving rise to the notion, that QE3 may be larger than expected.
Full article
Therefore thinking contrary to what I see on the SPY and VIX charts, currency markets and credit market point us to extreme weakness, reflection of which should begin on equity markets over the coming weeks/months. Dollar charts as pointed by us here are well on its way to 80 levels. Gold:TLT ratio here points to a sustained rally in bond markets and therefore further supporting the risk aversion trade. Will the trigger be Bernanke QE3 which may be massive disappointment.
This is a premium analysis for subscribers.
If you are not yet a premium subscriber you can do so now and be updated of trend and pattern analysis charts and daily and medium term trade portfolio. Premium Subscription.
Our feeds: RSS feedOur Twitter: Follow Us
Kate
Capital3x.com
Kate, trading experience with PIMCO, now manage capital3x.com. Check performance before you subscribe.
© 2011 Copyright Capital3X - All Rights Reserved
Disclaimer: The above is a matter of opinion provided for general information purposes only and is not intended as investment advice. Information and analysis above are derived from sources and utilising methods believed to be reliable, but we cannot accept responsibility for any losses you may incur as a result of this analysis. Individuals should consult with their personal financial advisors.
© 2005-2022 http://www.MarketOracle.co.uk - The Market Oracle is a FREE Daily Financial Markets Analysis & Forecasting online publication.