


Gold Warnings Come True, Whilst Silver Falls Off the Cliff
Commodities / Gold and Silver 2011 Sep 25, 2011 - 03:38 AM GMTBy: Merv_Burak

 Indicator warnings come true sometimes and don’t at other times. Timing is the difficult thing with indicators. This past week the warnings over the past few weeks came true with a vengeance. Now what?
WARNINGS or PREDICTIONS ?
Warnings keep you on your toes for possible changes ahead, predictions have a nasty habit of lulling one to sleep while one focuses on the prediction. Pay attention to warnings, do not focus on predictions.
Warnings imply POTENTIAL changes of direction ahead, to the up side or the down side. Predictions imply knowledge of the future, which I try to leave up to the fortune tellers.
In these commentaries I try to keep to the warnings but I’m human and the ego sometimes gets the better of me so you might find some predictions occasionally within the commentary. Stay focused on the warnings and treat the predictions as fortune telling. Sometimes the predictions come true and there lies the real problem. When one starts to think one can actually predict the future that’s when things can end in disaster.
Warnings do not mean certainty. One should, however, always keep them in mind when trading or investing and to be prepared for the occasion when they may come true.
GOLD
LONG TERM
Well, things are looking a little more difficult for the long term BUT the action of last week still did not change things from this time period standpoint. Those who focus on the long term and ignore the short or intermediate term fluctuations still do not have anything to worry about. Of course, by time the long term trend has changed the price of gold will almost by definition be a lot lower. The long term investor usually gets in late and gets out late (if at all).
Trend: Gold closed on Friday still comfortably above its positive sloping long term moving average line. By comfortably I am referring to normal trading days, not like days such as Friday. One more of those days and gold will be below the moving average line. Gold also is still above that long term FAN trend line shown last week. As mentioned last week I do expect gold to remain within the confines of that long term FAN line and the intermediate term FAN line.
Strength: The long term momentum has been seriously weakened during the week but it had been weakening for a few weeks now. However, the indicator still remains comfortably in its positive zone although it is way below its negative trigger line.
Volume: As with everything else the volume indicator has now turned to the down side. It has broken below an up trend line that has kept the indicator positive since the beginning of the year. It has also moved below its long term trigger line although the trigger remains in a positive slope.
All in all, despite the week’s activities the long term rating remains BULLISH at the Friday close.
INTERMEDIATE TERM
Things got nasty very fast on the intermediate term.
Trend: The previous week gold broke below that second FAN trend line and moved into the zone between the first and second FAN lines. At the time I thought gold will remain within this zone for some time and that is what seems to be happening, at least for the time being. As can be expected gold moved below its intermediate term moving average line and the line slope is now to the down side.
With this week’s plunge gold has now confirmed the development of a double top by moving below the low point between the two tops. As predictions go a confirmation of the double top would suggest a move to the $1490 level or the lateral area previously formed by the May/June activity (see chart in the next section).
Strength: Friday’s action has taken the intermediate term momentum indicator below its neutral line into the negative zone. It is also well below its negative sloping intermediate term trigger line.
Volume: The volume indicator has now moved further below its intermediate term trigger line and the trigger has now turned to the down side.
Nothing good here, at the Friday close the intermediate term rating is now a full BEARISH rating. However, this is not yet confirmed by the short term moving average line. Although the short term line is moving lower quite fast it still closed on Friday above the intermediate term moving average therefore not yet confirming the bear.
SHORT TERM
The short term bear was there last week and it remains. At this point the short term bear is so severe that one might just be looking for a bounce of some sort.
Shown on the chart is the double top box mentioned in the intermediate term comments. Too often analysts jump the gun and declare this a double top as soon as the second top has developed but I prefer to wait for confirmation by the breaking of that in-between tops low. This occurred on Friday.
Trend: As you can well imagine, the short term trend is now well established. Gold is way below its short term negative sloping moving average line. It is so far from the line that a
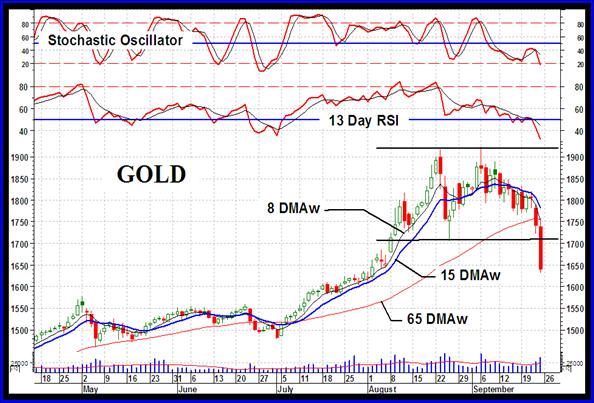
bounce of some sort almost becomes a serious 90% prediction (leaving at least 10% for further possible confusion).
Strength: After toying with its neutral line the short term momentum indicator has now moved decisively into its negative zone and below its negative trigger line. One can see this coming after the weakness it had shown during the second top activity in early Sept.
Volume: The daily volume is most definitely on the negative side. The plunge in the gold price on Thursday and Friday was on increasing volume action. One slight positive is that although this volume was increasing it was still not at the negative value that we had during the two top areas.
At the Friday close the short term rating can only be BEARISH. This is confirmed by the very short term moving average line moving ever lower below the short term line.
As for the immediate direction of least resistance, one should be looking at the down side but I think that the down side has been overdone for now. Other than the Stochastic Oscillator entering its oversold zone (but not yet reversing) there is no real evidence of a reversal but I’ll go with the up side, either Monday or Tuesday.
SILVER
WOW! While gold looks to have had a somewhat controlled drop silver on the other hand just looks like it fell off the cliff.
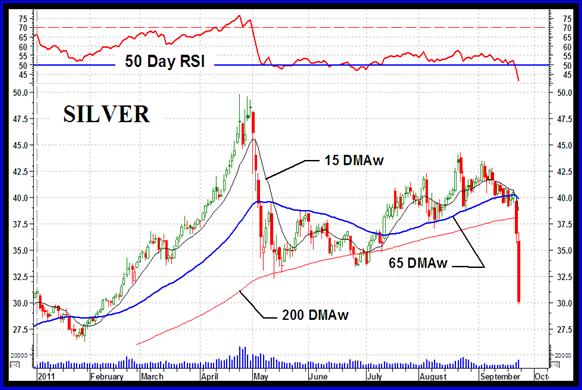
My usual long term P&F chart often shown in this space now shows that the drop in the price of silver has broken below two separate support levels, one projecting a move to the $28 level (where it is almost at) and the other projecting to the $13 level where it was in 2009. The first looks very reasonable while the second looks to be a long shot, but there you are.
LONG TERM
Unlike gold, silver long term indicators have now been badly breached.
Trend: Silver has broken below a several month support and has moved below its long term moving average line. The line has also turned to the down side.
Strength: The long term momentum indicator has now moved into its negative zone for the first time since Feb of 2009 when the silver price was $15. The indicator is also well below its negative sloping trigger line.
Volume: The volume indicator is starting to move lower and has moved below its long term trigger line although the trigger is still in an upward slope.
At the Friday close the long term rating has now shifted to a full BEARISH rating.
INTERMEDIATE TERM
A lot of damage has been done as far as the intermediate term is concerned and it might take some doing to get back on track.
Trend: On Thursday silver broke below an intermediate term support (on Friday it broke below the long term one). It is also below its intermediate term negative sloping moving average line.
Strength: The intermediate term momentum indicator has decisively moved into its negative zone and below its negative sloping trigger line.
Volume: The volume indicator has now moved below its intermediate term trigger line and the trigger has also turned to the down side.
On the intermediate term the rating at the Friday close is BEARISH. This is confirmed by the short term moving average line moving ever lower below the intermediate term line.
SHORT TERM
As the chart shows, Thursday and Friday were a disaster for silver. It will take some time to recover. That does not mean there might not be some up days along the way.
Trend: The disaster has taken silver well below its short term moving average line with the line sloping downward.
Strength: The short term momentum is at its lowest level since Sept of 2008. One should expect a bounce anytime from these momentum levels although the indicator has not yet shown any hint of turning around. It remains deep in its negative zone below its negative sloping trigger line.
Volume: The daily volume action is somewhat positive. That sounds strange seeing as how the price has dropped off a cliff. However, the recent volume pales in comparison to the volume in the past. In the April/May period we had very high daily volume action, which was typical for end of trend volume action at the end of a long advance. At the end of Aug the volume was higher than this week although that still has a chance of changing. For now it looks like speculators are not rushing out to sell silver, they are just not rushing in to buy.
On the short term, at the Friday close, the rating is BEARISH. This is confirmed by the very short term moving average line moving lower below the short term line.
As for the immediate direction of least resistance, to assume the up side would only be a guess but that seems to be the more logical direction after a plunge of the past couple of days.
Merv’s Precious Metals Indices Table
Well, that’s it for this week. Comments are always welcome and should be addressed to mervburak@gmail.com.
By Merv Burak, CMT
Hudson Aero/Systems Inc.
Technical Information Group
for Merv's Precious Metals Central
For DAILY Uranium stock commentary and WEEKLY Uranium market update check out my new Technically Uranium with Merv blog at http://techuranium.blogspot.com .
During the day Merv practices his engineering profession as a Consulting Aerospace Engineer. Once the sun goes down and night descends upon the earth Merv dons his other hat as a Chartered Market Technician ( CMT ) and tries to decipher what's going on in the securities markets. As an underground surveyor in the gold mines of Canada 's Northwest Territories in his youth, Merv has a soft spot for the gold industry and has developed several Gold Indices reflecting different aspects of the industry. As a basically lazy individual Merv's driving focus is to KEEP IT SIMPLE .
To find out more about Merv's various Gold Indices and component stocks, please visit http://preciousmetalscentral.com . There you will find samples of the Indices and their component stocks plus other publications of interest to gold investors.
Before you invest, Always check your market timing with a Qualified Professional Market Technician
Merv Burak Archive |
© 2005-2022 http://www.MarketOracle.co.uk - The Market Oracle is a FREE Daily Financial Markets Analysis & Forecasting online publication.