


Stock Market Elliot Wave Count Now Clearer
Stock-Markets / Stock Markets 2011 Oct 02, 2011 - 10:52 AM GMTBy: Tony_Caldaro

 This recent week played out like the week before: a rally into tuesday and then a pullback for the rest of the week. Nevertheless, most of the world’s indices were higher and Europe gained 5.2%. In the US economic reports came in mixed. On the uptick: Case-Shiller housing prices, consumer confidence/sentiment, Q2 GDP, the Chicago PMI, the monetary base, and weekly jobless claims dropped under 400K. On the downtick: new/pending home sales, durable good orders, personal income/spending, excess reserves, PCE prices, the WLEI and the M-1 multiplier. US markets ended mixed with the SPX/DOW mixed, and the NDX/NAZ -2.9%. Asian markets gained 0.5%, the Commodity equity group gained 0.3%, and the DJ World index gained 0.9%. Next week’s economic reports include: the monthly Payrolls report, ISM and Auto sales.
LONG TERM: bear market highly probable
Our technical indicators continue to suggest a bear market has been underway since May in the SPX/DOW (industrials), and July in the NDX/NAZ (technology). The fact that their bull market tops occurred months apart is actually a positive for this bear market. When these indices are in sync the market can move quite quickly with the main trend, as demonstrated by the 2007-2009 bear market and 2009-2011 bull market. Not only are the industrials and technology out of sync, many of the other US indices and even the SPX sectors are moving at different patterns. Again a positive for this bear market.
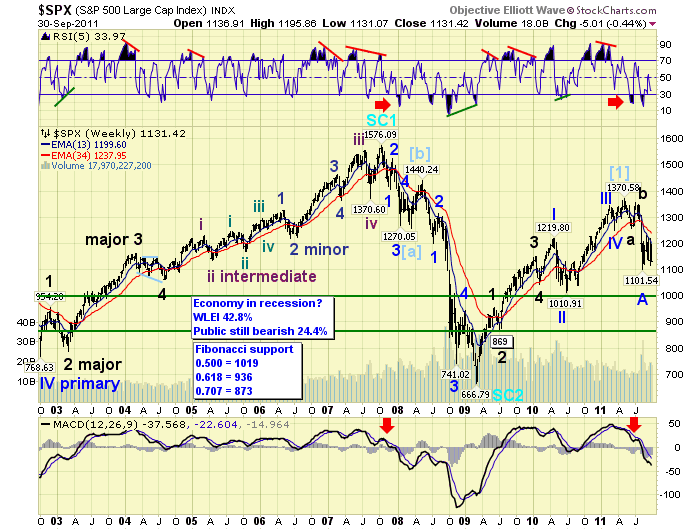
The weekly chart continues to display technical deterioration. The MACD is below neutral and still declining, and the RSI has been oversold twice already in the past three months. This type of activity usually occurs only in bear markets. Since we counted five Primary waves up from the Mar09 low to the May11 high, we continue to expect initial bear market support at the Primary wave II low of SPX 1011. Worse case support is at SPX 869, Major wave 2 of Primary wave I. Fibonacci support is at SPX 1019, 936 and 873 as posted on the chart. Notice the first and last of these support ratios are right around the two levels already noted. And, we have OEW pivots at 1018, 1007, 944 and 876 to further solidify these support levels.
MEDIUM TERM: uptrend confirmed
The good news is, we finally received an OEW uptrend confirmation during all this choppy activity. The bad news is, we are already close to confirming another downtrend. This happens, sometimes, during extended choppy market activity. The important thing, at this point, is we now know where the downtrend ended, and can offer a more concise count going forward. One of the main benefits of OEW compared to conventional EW.
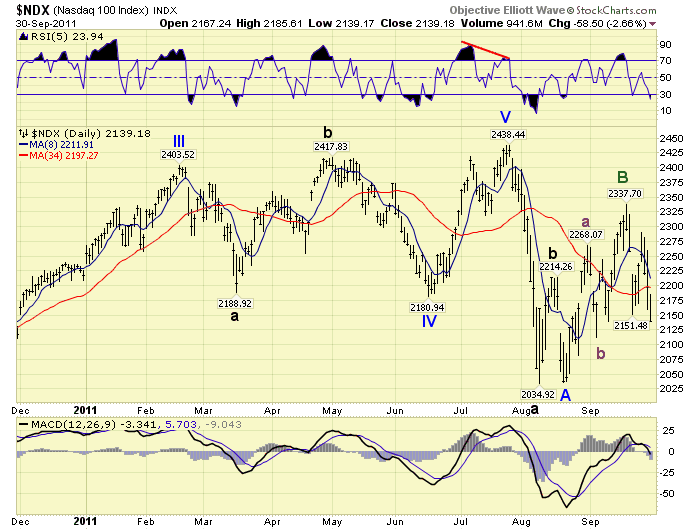
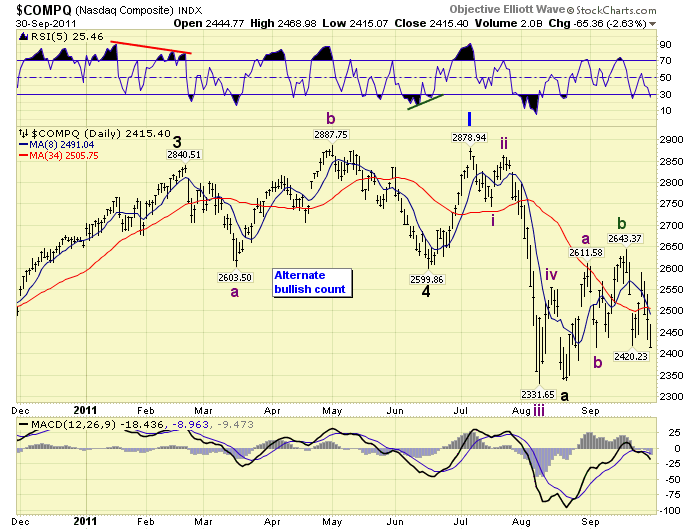
When we reviewed all the charts we found quite a mixture of wave patterns. The SPX/DOW have done three waves down from the May11 high, and are now in their fourth wave. The NDX/NAZ have done one wave down from their July11 high, and are now in their second wave. The NYSE/R2K have done three waves down from their May11 high and are still downtrending. And, the TRAN has done one wave down from its July11 high and is still downtrending. This bear market decline is quite fragmented.
When we put the secondary indices aside and concentrate more on the four major indices we can draw some conclusions. First, the SPX/DOW and NDX/NAZ topped at different times: May and July respectively. Second, even though they have topped at different times eventually they will get back into sync with each other. After the SPX/DOW topped in May they had about an 8% decline, retaced most of that decline, and then had a sharp selloff for a total market loss of about 19% at the August low. The NDX/NAZ topped in July and then had a sharp selloff of about 18% into their August low. Notice at the August low all four major indices had about the same market loss for this bear market. That August low also coincided with an extreme oversold condition, even for a bear market, as we had noted at the time with the chart below.
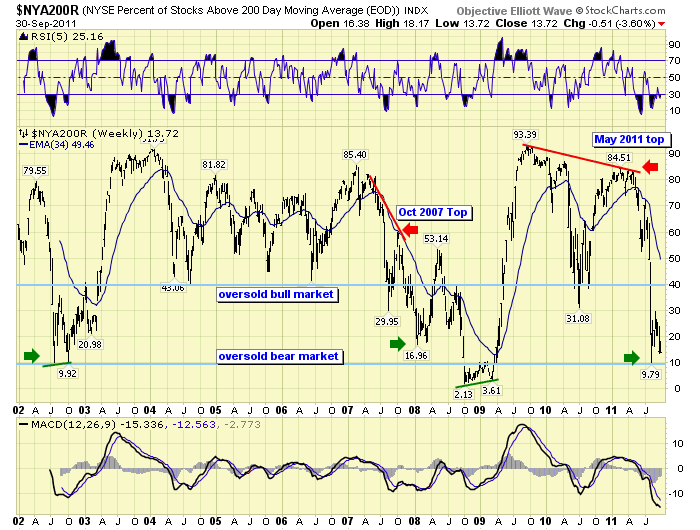
When we combine these two factors, the similar percentage of decline into the August low and the oversold condition, and apply them to the wave structures of the four majors we arrive at one highly probable conclusion. August was a signficiant low that should have aligned these four indices’ wave structures. With this in mind, we reviewed the wave counts of all four major indices, including probable alternatives, and only had to update the SPX charts, returning it to our original count.
The most probable wave count aligns all four major indices, at the August low, with a Primary wave A. The SPX/DOW did a three Major wave ABC decline into that low, and the NDX/NAZ did a three wave ABC decline into that low as well.
Although the three waves in the NDX were all part of one trend.
This preferred count suggests the market has been in a counter-trend Primary wave B rally since the August low. When concluded, another three Major waves down should follow, in the months ahead, to complete the bear market with a Primary wave C, at one of the previously noted bear market support levels.
We also offer two alternate counts, one posted on the DOW charts and another on the NAZ charts. The DOW count suggests the decline has been three major waves, labeled instead as 1-2-3, and the recent uptrend is/was a fourth wave triangle. This count suggests Primary A will be completed at the next downtrend low, completing five Major waves down. Since there has yet to be an overlap between any of the trends this is still a viable count.

The NAZ chart offers a completely different view. It suggests, and this is still possible, the five wave advance from Mar09-May/July11 only completed Primary wave I of the Cycle wave [1] bull market. The recent decline from the highs is part of only a Primary wave II correction, and the bull market will resume when it concludes.
The past few weeks have been a day traders delight. Fortunately we were able to track this uptrend, with its twists and turns, until about the last week or so. Now that OEW has confirmed an uptrend from the August low, which is what we were expecting most of the time, this market should now start trending again.
SHORT TERM
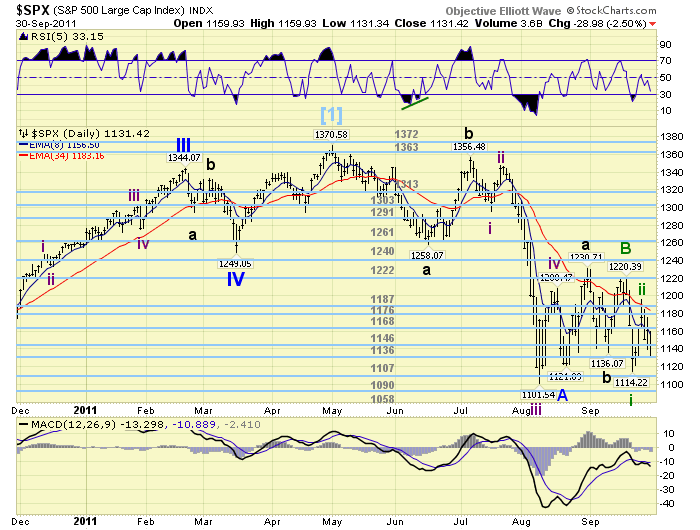
Support for the SPX is at 1107 and then 1090, with resistance at 1136 and then 1146. Short term momentum has been displaying positive divergences as this last decline, from SPX 1196, has unfolded. This sometimes occurs during a third wave.
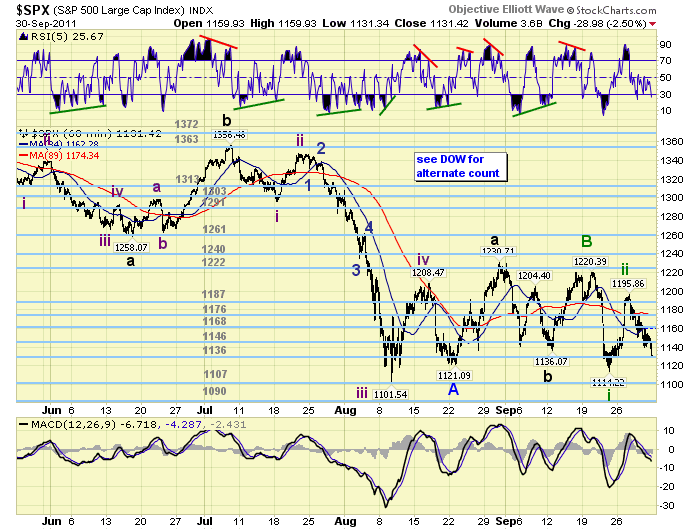
From the Primary wave A low at SPX 1121 we count an abc Major A, an abc Major B, and a five wave Major C completing an inverted failed flat at SPX 1220. A final rally to SPX 1231 would have made it a normal flat. Failed inverted flats often occur when a market too weak to complete the pattern. Since this has been a news driven market, with the news swinging from positive to negative almost every day, this is not all that surprising.
From the tentative Primary wave B high at SPX 1220 the market had its biggest selloff since the choppy activity began in August: 106 points to 1114. We are labeling this decline as Intermediate wave i of the next downtrend. The sharp rally that followed to SPX 1196 is indicative off all the second waves during this bear market: a rally that retraces most of the first decline. We labeled that high as Intermediate wave ii. The decline from the SPX 1196 high has been quite steady, and it appears to be Intermediate wave iii. Should this be the correct count the market should be making new bear market lows next week. Short term support is around SPX 1120 and then the 1107/1090 pivots. Overhead resistance is at the 1136/1146 pivots and the mid-1150′s. Best to your trading!
FOREIGN MARKETS
The Asian markets were mixed on the week for a net gain of 0.5%. India’s BSE is the only one in an uptrend.
The European markets were all higher on the week for a net gain of 5.2%. England’s FTSE and Switzerland’s SMI are in uptrends.
The Commodity equity group were mixed on the week for a net gain of 0.3%. Brazil’s BVSP is the only one in an uptrend.
The DJ World index is still downtrending but gained 0.9% on the week.
COMMODITIES
Bonds are still uptrending but lost 0.7% on the week.
Crude’s uptrend attempt failed, lost 1.3% on the week, and is still downtrending.
Gold stabilized somewhat this week losing 2.1%. It has now corrected to levels, and more, typically associated with medium term support during this 10 year bull market. And, it is oversold on the daily and weekly timeframes.
The USD continues its uptrend but gained only 0.1% on the week. The EURUSD is still downtrending losing 0.8%. The JPYUSD is still uptrending but lost 0.5% on the week. When the JPYUSD starts downtrending the USD (DXY index) should make more upside progress.
NEXT WEEK
Another busy economic week ahead. Monday kicks it off with ISM manufacturing and Construction spending at 10:00, then Auto sales in the afternoon. Tuesday we have Factory orders, and then on wednesday the ADP index and ISM services. On thursday weekly Jobless claims, then on friday the monthly Payrolls report, Wholesale inventories and Consumer credit. The FED has a speech and congressional testimony scheduled for tuesday. First a speech by FED governor Raskin in Columbia, MD at 9:00. Then Congressional testimony by FED chairman Bernanke, on economic outlook and monetary policy, at 10:00.
Remember the market activity from May/July is typical of a bear market. Investors should have opted to take the necessary precautions in July and early August at the lastest. A defensive posture still seems to be the order of the day, until the ECB and/or the FED start another major liquidity program to offset the deflationary pressures of the Secular bear cycle. Until then, it appears this market is heading lower. Best to your weekend and week!
CHARTS: http://stockcharts.com/...
http://caldaroew.spaces.live.com
After about 40 years of investing in the markets one learns that the markets are constantly changing, not only in price, but in what drives the markets. In the 1960s, the Nifty Fifty were the leaders of the stock market. In the 1970s, stock selection using Technical Analysis was important, as the market stayed with a trading range for the entire decade. In the 1980s, the market finally broke out of it doldrums, as the DOW broke through 1100 in 1982, and launched the greatest bull market on record.
Sharing is an important aspect of a life. Over 100 people have joined our group, from all walks of life, covering twenty three countries across the globe. It's been the most fun I have ever had in the market. Sharing uncommon knowledge, with investors. In hope of aiding them in finding their financial independence.
Copyright © 2011 Tony Caldaro - All Rights Reserved Disclaimer: The above is a matter of opinion provided for general information purposes only and is not intended as investment advice. Information and analysis above are derived from sources and utilising methods believed to be reliable, but we cannot accept responsibility for any losses you may incur as a result of this analysis. Individuals should consult with their personal financial advisors.
© 2005-2022 http://www.MarketOracle.co.uk - The Market Oracle is a FREE Daily Financial Markets Analysis & Forecasting online publication.