The Stock Market Could Soon Bottom and Nobody Knows It
Stock-Markets / Stock Markets 2011 Oct 03, 2011 - 09:55 AM GMTBy: David_Banister
 The prevailing universal sentiment is neutral to bearish by advisors and the general investing public. Who can really blame them given the Euro-Zone mess, the potential bank contagion collapse effect, and the weak economic trends both here and overseas. However, the work I do is almost entirely behavioral based analysis looking at crowd or herd behavioral patterns.
Right now, things are adding up to a market bottom as early as the October 7th-11th window of time and no later than October 28th . The figures I have had for a long time are 1088 for a bottom with a possible worst case spillover of 1055-1062 in the SP 500. We are already eyeing the Gold stocks as bottoming out as well and have begun to nibble and will add on further dips.
Let’s examine some of the evidence and then look the charts as well:
- Sentiment in recent individual investor surveys had only 25% of those polled bullish. Historically that average is 39% or higher.
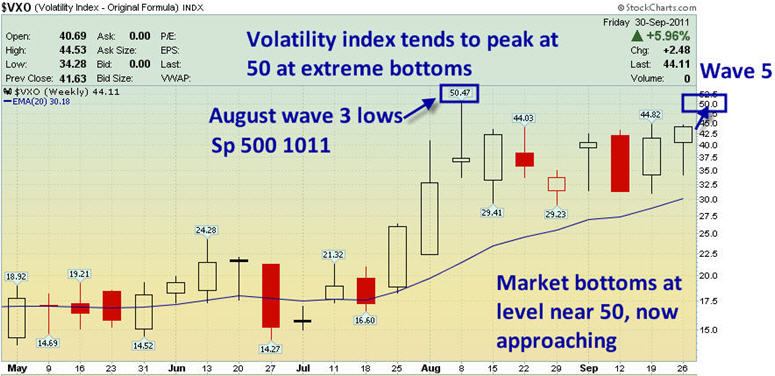
- The volatility index has been pegging the 43-45 window recently and historically markets have major reversals anywhere from 45-50, with rare cases of that index going over 50 without a major reversal
- The German DAX index is carving out what looks like a bottom channel, and if it can hold the 5300 plus ranges, it could be a leading indicator of a US stock market run
- Seasonally, markets tend to bottom in the September-October window with favorable patterns from November into March/April.
- Historically, markets tend to correct hard with a “New Moon in Libra” which occurred last Tuesday, the same day the market peaked at 1196 and rolled over hard. They often bottom with the following Full moon, which is scheduled for October 11th.
- Elliott Wave patterns I use indicate we are in the final 5th wave stage since the 1370 Bin Laden highs, with a gap in the SP 500 chart at 1088 from September 2010 still to fill. That gap happens to coincide as 78.6% Fibonacci retracement of the 2010 lows to the 2011 highs. It’s also has a 50% Fibonacci correlation with the 1356 high to 1101 swing move this summer.
Bottom line is the SP 500 has withstood a ton of pots and pans and bad news over the past 8 weeks. The market tends to price in a soft patch in the economy way before it becomes evident in the data. To wit, when we topped at 1370 in May of this year, it was an exact 78.6% retracement to the upside of the 2007 highs to 2009 lows. The pullback to 1101 is an exact 38% Fibonacci retracement of the 2011 highs and the 2009 lows. Markets are not as random as everyone things, and if you can lay out a roadmap in advance and understand where key pivots are, you can swing the opposite direction of the herd and profit quite handsomely. This is what I do every week at my ActiveTradingPartners.com trading service; go against the crowd for handsome profits.
Below are two charts showing two likely outcomes in the SP 500 index in the coming several days to few weeks:


Forewarned is forearmed as they say. If you’d like to stay ahead of the curve on Gold, Silver, and the SP 500 on a consistent basis, take a look at www.MarketTrendForecast.com , where you can sign up for occasional free reports and/or take advantage of a temporary 33% off coupon to join us!
Dave Banister
CIO-Founder
Active Trading Partners, LLC
www.ActiveTradingPartners.com
TheMarketTrendForecast.com
Dave Banister is the Chief Investment Strategist and commentator for ActiveTradingPartners.com. David has written numerous market forecast articles on various sites (MarketOracle.co.uk, 321Gold.com, Gold-Eagle.com, TheStreet.Com etc. ) that have proven to be extremely accurate at major junctures.
© 2010 Copyright Dave Banister- All Rights Reserved
Disclaimer: The above is a matter of opinion provided for general information purposes only and is not intended as investment advice. Information and analysis above are derived from sources and utilising methods believed to be reliable, but we cannot accept responsibility for any losses you may incur as a result of this analysis. Individuals should consult with their personal financial advisors.
© 2005-2022 http://www.MarketOracle.co.uk - The Market Oracle is a FREE Daily Financial Markets Analysis & Forecasting online publication.


