


Gold Failing to Break Higher, More Downside Ahead?
Commodities / Gold and Silver 2011 Oct 09, 2011 - 06:26 PM GMTBy: Merv_Burak

 Ho-Hum! 50 points here, 50 points there but really not going anywhere. Gold can’t seem to get any upside steam. Is more downside ahead?
GOLD : LONG TERM
Trend: Gold remains above its slightly positive long term moving average line but is in a very precarious state. A close at or below $1585 would place gold below the line and most likely the line would turn downward at that point. Such close would also place gold below the FAN line number 1, which has been considered as a long term support line.
Strength: The recent price action has not shown much strength when viewed by the long term momentum indicator. The indicator is still in its positive zone but only by a few % points. It remains below its negative sloping trigger line suggesting a continuing weakness in the move.
Volume: With the week’s gold action being basically of a lateral direction the volume indicator has been moving in a likewise manner during the week. It does remain below its negative sloping long term trigger line.
At the Friday close the long term rating remains BULLISH but a very weak bull at this time. We need some upside price action to improve the strength of the rating.
INTERMEDIATE TERM
The action during the week was basically a lateral drift type of action. We need some improved volume upside activity to get back into a bullish mode.
Trend: Gold remains below its negative sloping intermediate term moving average line and below FAN line number 2 which had been considered as an intermediate term line. The action remains trapped between FAN lines 2 and 1 as expected. A close above the $1682 level just might give us that push into even greater heights but that would still be below the moving average line.
Strength: The intermediate term momentum indicator has been moving in a lateral drift for the past two weeks, just below its neutral line. The negative sloping trigger line had moved below the indicator during the week but now the indicator is below the trigger.
Volume: As mentioned above, the volume indicator has been moving laterally this past week but remains below its negative sloping intermediate term trigger line.
At the Friday close the intermediate term rating remains BEARISH, confirmed by the short term moving average line tracking below the intermediate term line.
SHORT TERM
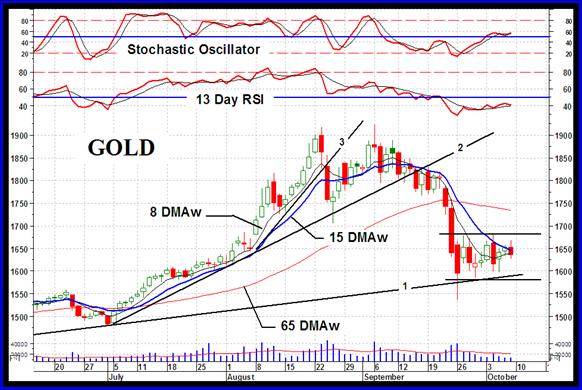
As the chart shows, the short term action has gone into a lateral drift giving us a box pattern. A break-out from this box should clue us in to the direction of the next move. Should the break be to the up side that would not necessarily indicate a new bull market ahead as there is a lot of resistance in the $1800 to $1900 area from earlier action. It would take a serious move to get through that area. My guess, and it’s only a guess, is that the eventual break will be to the down side with the next support in the high $1400 level. BUT let’s let the daily action tell us what’s what.
Trend: A couple of upside days during the week but gold could not break above its downward sloping short term moving average line.
Strength: The short term momentum indicator has been inching upwards during the week and remains above its positive sloping trigger line but unfortunately the indicator itself is still in its negative zone.
Volume: The daily volume activity remains low, which is the expected volume during a short rest in a down trend. The short term average volume line has been sloping downward for the past couple of weeks again indicating a continual lowering of the volume activity as time goes by.
At the Friday Close the short term rating remains BEARISH but not strongly so. It would not take much more upside to improve this rating. This bear is still confirmed by the very short term moving average line remaining below the short term line. However, the very short term line is moving upwards and very close to breaking above the short term line.
As for the immediate direction of least resistance, The Stochastic Oscillator is in its positive zone and the very short term moving average line is trending upwards but the Friday action is giving me cause for concern. I’ll go with the lateral direction for the next day or two until things firm up a little better.
SILVER
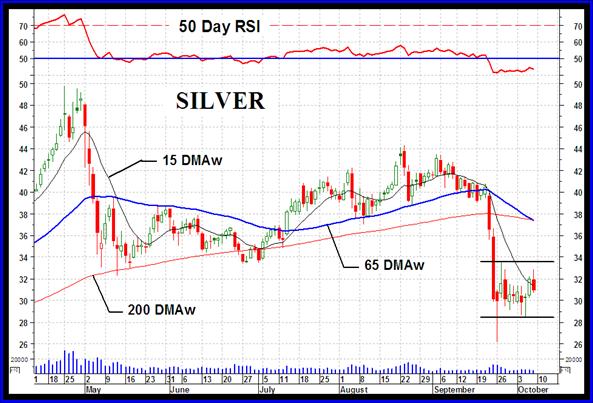
Although silver had a better week than did gold it is still the weaker recent performer of the two. We do see a similar box pattern forming in silver but the overall strength suggests the down side still more in command than is the up side.
LONG TERM
Silver went bearish in the long term P&F chart a few weeks back with an initial projection of $28. This it reached quite fast. The next downside projection, per the P&F chart, is to the $14 level. That seems so far away but there it is. Don’t risk any money on that projection but do keep it in mind as it is a valid P&F projection until a reversal is verified.
Trend: Silver had dropped below its long term moving average line a few weeks back and remains there. The moving average line is now in a definite downward slope.
Strength: The long term momentum indicator remains in its negative zone and below its negative sloping trigger line.
Volume: Similar to the gold volume indicator, the silver volume indicator has been tracking a lateral path these past couple of weeks. It remains below its negative trigger line.
At the Friday close the long term rating remains BEARISH.
INTERMEDIATE TERM
Trend: Silver remains well below its negative sloping intermediate term moving average line.
Strength: The intermediate term momentum indicator remains in its negative zone but has moved above its trigger line. The trigger, however, remains in a negative slope.
Volume: Although moving in a lateral direction the volume indicator remains below its negative sloping trigger line.
At the Friday close the intermediate term rating remains BEARISH. This is confirmed by the short term moving average line remaining below the intermediate term line.
SHORT TERM
Trend: Silver moved above its short term moving average line on Thursday but closed below the line on Friday. The moving average line remains sloping downwards throughout. Of greater importance, silver is in a box and needs to get out of the box before any trend can be confirmed.
Strength: The short term momentum indicator is showing greater strength than the price action would suggest. However, it is still in its negative zone but above its positive sloping trigger line.
Volume: The daily volume action remains very low and not giving us any particular message.
On the short term at the Friday close the rating remains BEARISH, confirmed by the very short term moving average line.
Merv’s Non-Edibles Futures Indices Table
I have decided to concentrate on the precious metals in these commentaries and have omitted the tables and comments Re: the precious metal stocks. The Merv’s Non-Edibles Futures Indices Table will be shown here rather than the Precious Metals Indices Table, which refers to stock activities.
Those interested in precious metal stocks may still get the Table along with stock commentaries in the Subscriber’s section of the Precious Metals Central service at http://preciousmetalscentral.com.
Well, that’s it for this week. Comments are always welcome and should be addressed to mervburak@gmail.com.
By Merv Burak, CMT
Hudson Aero/Systems Inc.
Technical Information Group
for Merv's Precious Metals Central
For DAILY Uranium stock commentary and WEEKLY Uranium market update check out my new Technically Uranium with Merv blog at http://techuranium.blogspot.com .
During the day Merv practices his engineering profession as a Consulting Aerospace Engineer. Once the sun goes down and night descends upon the earth Merv dons his other hat as a Chartered Market Technician ( CMT ) and tries to decipher what's going on in the securities markets. As an underground surveyor in the gold mines of Canada 's Northwest Territories in his youth, Merv has a soft spot for the gold industry and has developed several Gold Indices reflecting different aspects of the industry. As a basically lazy individual Merv's driving focus is to KEEP IT SIMPLE .
To find out more about Merv's various Gold Indices and component stocks, please visit http://preciousmetalscentral.com . There you will find samples of the Indices and their component stocks plus other publications of interest to gold investors.
Before you invest, Always check your market timing with a Qualified Professional Market Technician
Merv Burak Archive |
© 2005-2022 http://www.MarketOracle.co.uk - The Market Oracle is a FREE Daily Financial Markets Analysis & Forecasting online publication.