Stock Market Unpunctured Cycle Report “Risk Off”
Stock-Markets / Stock Markets 2011 Oct 20, 2011 - 02:24 AM GMTBy: Submissions
 Robert M. Williams writes: When I last wrote about the stock market it appeared that we had experienced a major break to the down side as the Dow, the S & P and the Transports all closed at new lows for the year. This took place on October 3rd with the Dow closing at 10,655 and well below the August low of 10,713. This of course was confirmed by the Transports as they closed at a new low of 4,038 on that exact same day. October 3rd was the second of two consecutive 90% down days and was highlighted by 836 stocks reaching a new 52-week low. Then on October 4th we saw even more stocks, 1,202 altogether, closing at new 52-week lows and I don’t remember so many stocks making new lows, at least over the last twenty years. This of course was a sign that sellers had finally exhausted the urge to part with stocks at any priced and I saw it at the time but failed to recognize it for what it was, i.e. an exhaustion of some sort.
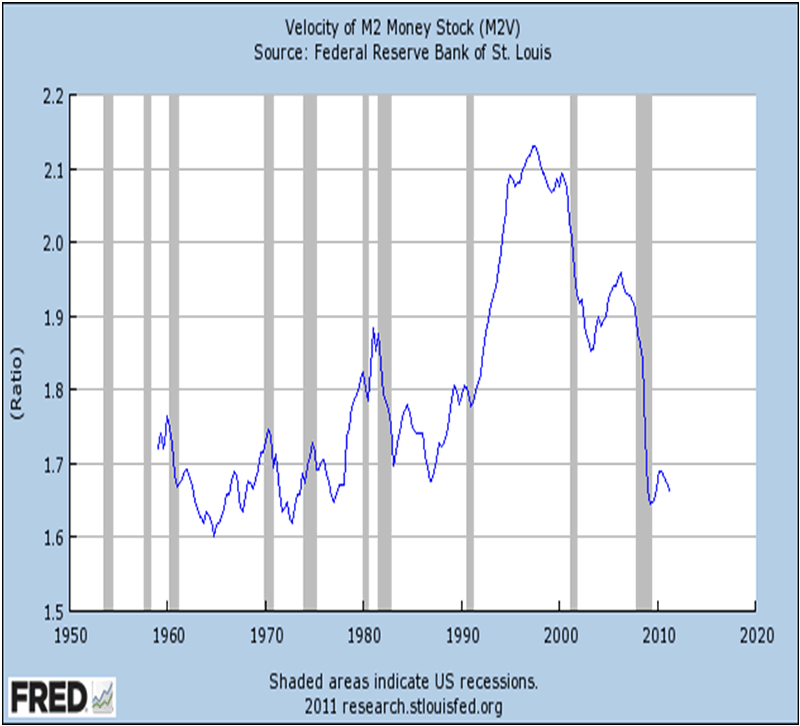
Many people interpreted the rebound that followed as a definitive bottom and an indication that further quantitative easing in Europe, and eventually the US, would solve all of our problems. I wish things were as simple as that, but I can assure you they never are. The US has made a habit of postponing the medicine needed to compensate for decades of easy money policy and they’ve allowed themselves to believe that you can have a free lunch every day. This of course leads to distortions and unintended consequences, and here we have a picture of one such unintended consequence:

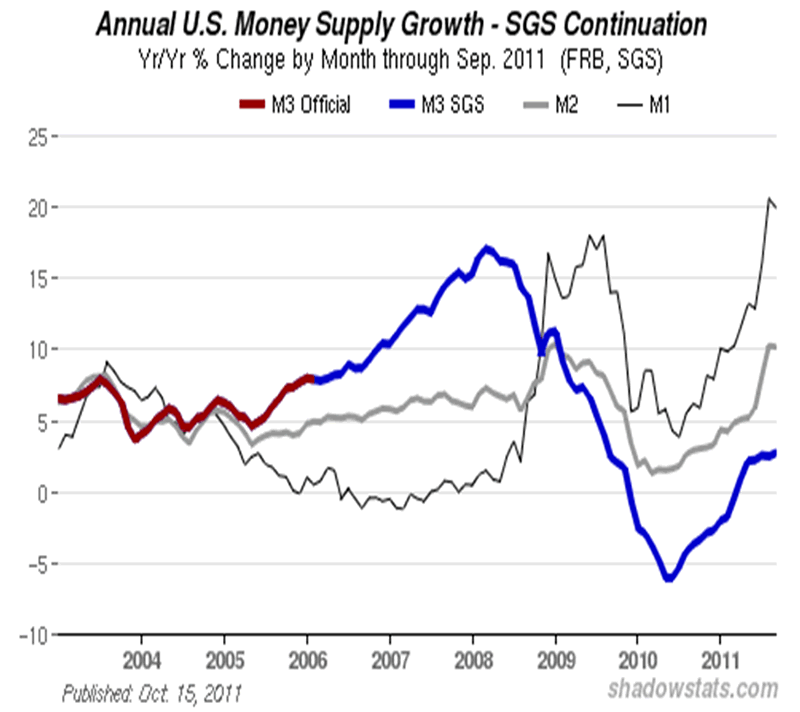
This is a chart of the velocity of money and it tells you how fast a dollar moves through the economy. As you can see the speed has slowed to a multi-decade low. This is particularly disconcerting when you look at this next chart of the money supply:

You can see that the Fed has been busy printing the numbers off of the plates for more than a year and a half! This divergence between supply and speed tells us that the general public has not been a beneficiary of the Fed’s printing binge. It also tells us that the more than US $3 trillion the Fed created out of thin area did not produce growth, jobs or infrastructure. All it produced is debt and that has to end up being extremely deflationary, and there in lays our problem.
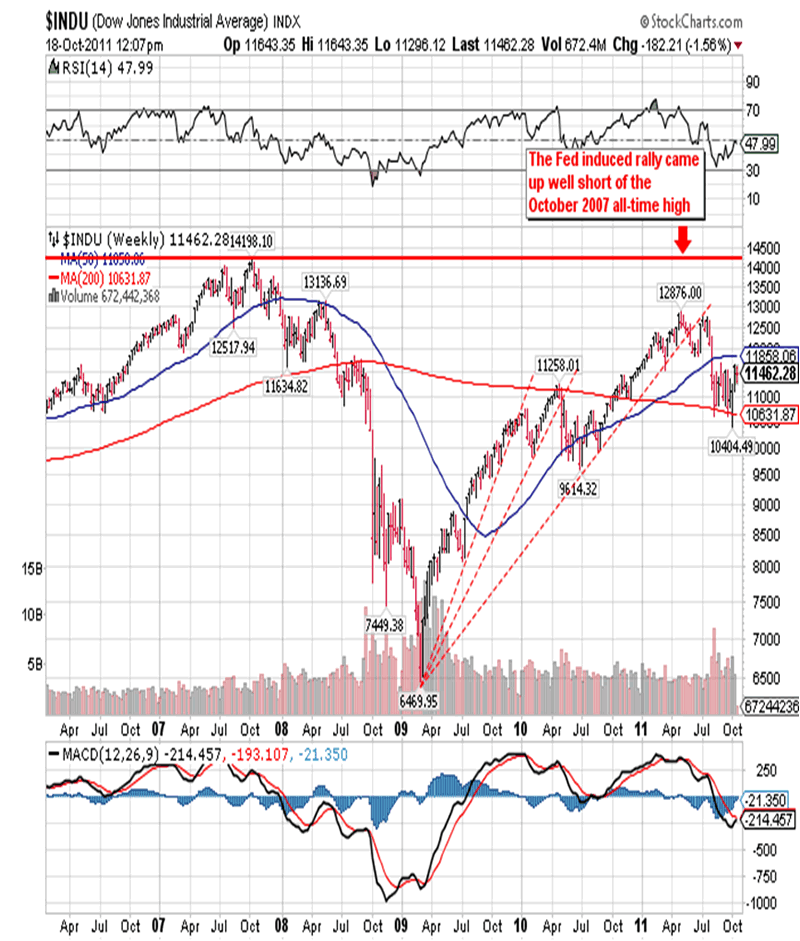
Previous episodes of monetary expansion drove the stocks to all-time highs and took housing prices along with it. This caused the average American to pile on debt after debt as if it were really an asset, and he did it with Sir Alan Greenspan’s blessing I might add. The following chart shows the all-time high in the Dow, the ensuing sharp decline, and another Fed induced rally to a significantly lower high:

You can also see how the rally ran out of gas, that’s when the Fed rushed in with QE2, and that led to a finally push up to the April 29th lower high. Since then the engine seems to have stalled and now the market is anxiously awaiting QE3, but that assumption assumes the market is stupid. We have two QE’s and neither has produced growth or jobs and neither have facilitated credit for the masses necessary to produce growth and jobs, so what good will a third QE do? The short answer is no good at all unless you think saving a handful of corrupted bankrupt financial institutions is worth sending the whole country down the drain.
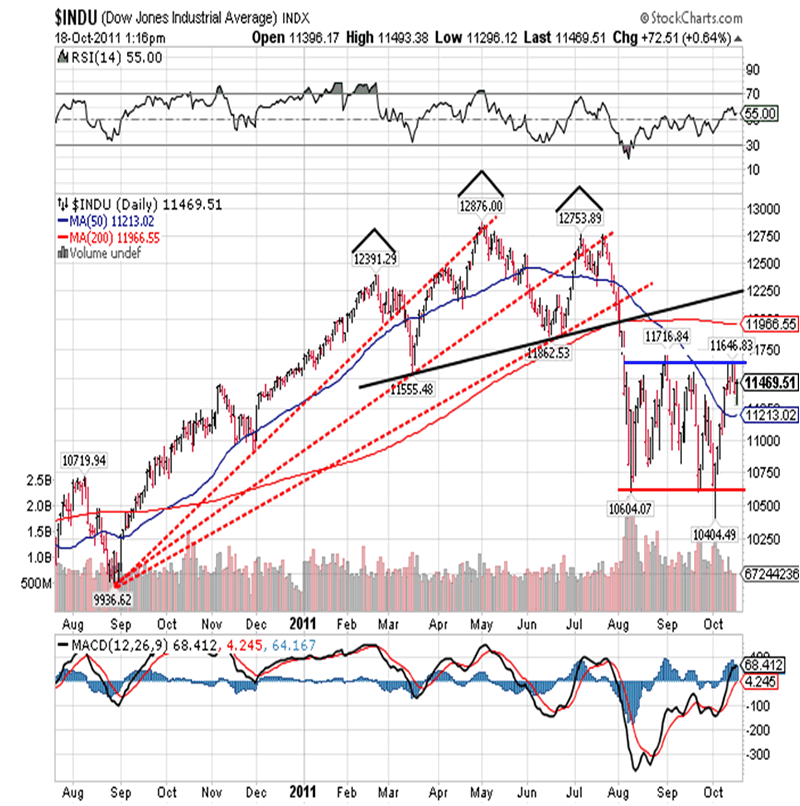
The question now is where do we go from here and we need to look at the following chart for some guidance:

Here you can see that the April high formed part of a head-and-shoulders top with an upward sloping neckline. The neckline was violated back in early August and this led to a break and close below the March closing low of 11,613. The decline stopped at 10,719 on August 10th and this was followed by yet another rebound.
As you can see on the right hand side of the chart, the Dow is basically trading in a range with the upside defined by the March low of 11,613 and the bottom defined by the August low of 10,713. Both have been broken on a closing bases and with the Transports confirming both breaks! Our most recent rally lasted nine days and produced a marginally higher close at 11,644 and then on Monday it turned back down with a 247-point decline. Tuesday followed with a 180-point gain as it was once again rumored that German and France approved a US $2.7 trillion bailout for the EU banks. You have to wonder how many times they can use the same rumor to prop up the market?
So far we’ve seen three attempts to move higher and three attempts to move lower and I suspect the next attempt, whether its higher or lower, will be a defining moment. Most analysts feel that the EU bailout along with an American QE3 will be enough to do the trick and push stock prices higher, but I have to ask why that would be the case. What does it solve? The answer of course is nothing. Too many people are now aware of that and then we have the Occupy Wall Street movement in over 170 cities around the world. This movement is telling the world that enough is enough, and it will turn violent. Too many people are making huge sacrifices so a very small group can control a large percentage of the world’s wealth. The many are now beginning to revolt and they will make it impossible for the few to govern. Good luck with that!
Robert M. Williams
www.unpuncturedcycle.com
theunpuncturedcycle@gmail.com
© 2011 Copyright Robert M. Williams - All Rights Reserved
Disclaimer: The above is a matter of opinion provided for general information purposes only and is not intended as investment advice. Information and analysis above are derived from sources and utilising methods believed to be reliable, but we cannot accept responsibility for any losses you may incur as a result of this analysis. Individuals should consult with their personal financial advisors.
© 2005-2022 http://www.MarketOracle.co.uk - The Market Oracle is a FREE Daily Financial Markets Analysis & Forecasting online publication.


