


Comparing the S&P in 2008 to Today
Stock-Markets / Stock Markets 2011 Oct 20, 2011 - 03:11 AM GMTBy: Mike_Paulenoff

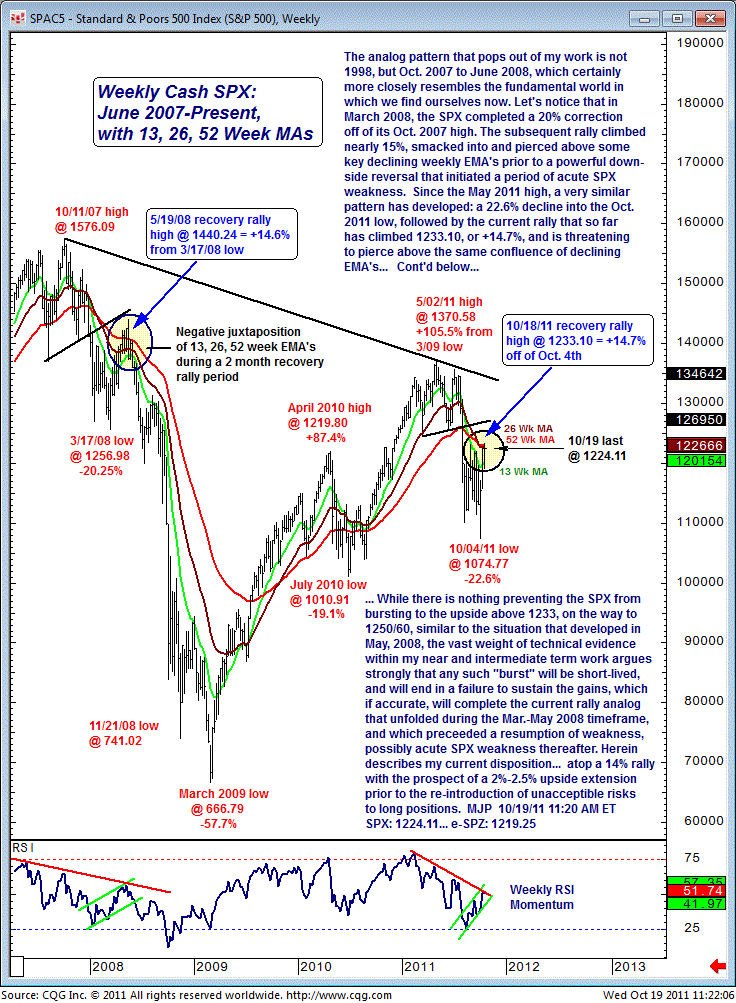
The analog pattern that pops out of my work is not 1998, but Oct 2007 to Jun 2008, which certainly more closely resembles the fundamental world in which we find ourselves now.
Let's notice that in March 2008, the S&P 500 completed a 20% correction off of its Oct 2007 high. The subsequent rally climbed nearly 15%, smacked into and pierced above some key declining weekly EMA's prior to a powerful downside reversal that initiated a period of acute SPX weakness.
Since the May 2011 high, a very similar pattern has developed: a 22.6% decline into the Oct 2011 low, followed by the current rally that so far has climbed 1233.10, or +14.7%, and is threatening to pierce above the same confluence of declining EMA's.
While there is nothing preventing the SPX from bursting to the upside above 1233 on the way to 1250/60, similar to the situation that developed in May 2008, the vast weight of technical evidence within my near- and intermediate-term work argues strongly that any such "burst" will be short-lived and will end in a failure to sustain the gains.
If accurate, this will complete the current rally analog that unfolded during the Mar-May 2008 timeframe, and which preceeded a resumption of weakness, possibly acute SPX weakness thereafter.
Herein describes my current disposition... atop a 14% rally with the prospect of a 2%-2.5% upside extension prior to the re-introduction of unacceptible risks to long positions.
Sign up for a free 15-day trial to Mike's ETF & Stock Trading Diary today.
By Mike Paulenoff
Mike Paulenoff is author of MPTrader.com (www.mptrader.com), a real-time diary of his technical analysis and trading alerts on ETFs covering metals, energy, equity indices, currencies, Treasuries, and specific industries and international regions.
© 2002-2011 MPTrader.com, an AdviceTrade publication. All rights reserved. Any publication, distribution, retransmission or reproduction of information or data contained on this Web site without written consent from MPTrader is prohibited. See our disclaimer.
Mike Paulenoff Archive |
© 2005-2022 http://www.MarketOracle.co.uk - The Market Oracle is a FREE Daily Financial Markets Analysis & Forecasting online publication.