


Stock Market New Uptrend Nearly Confirmed
Stock-Markets / Stock Markets 2011 Dec 04, 2011 - 09:47 AM GMTBy: Tony_Caldaro

 Markets, worldwide, surged this week on new optimism to a resolution of the European sovereign debt crisis. See the beginning of wednesday’s update for further details. European markets rose 9.6%, US markets +7.2%, Asian markets +5.9%, and the DJ World index +8.4%. Bond prices and the USD weakened, while Crude, Gold and the Euro rallied. Positive economic reports outnumbered negative reports by a ratio of 2:1. On the downtick: new homes sales, Case-Shiller, the WLEI and monetary base, plus weekly jobless claims rose. On the uptick: pending home sales, FHFA housing prices, construction spending, consumer confidence, the Chicago PMI, ISM, auto sales, the ADP and monthly Payrolls, plus the unemployment rate dropped. Next week ISM services, Consumer credit and the Trade deficit highlight a light economic agenda.
LONG TERM: neutral to bullish
What a difference one week can make in this volatile market. Last week markets had declined for the second week in a row, and third out of the last four, as the four week downtrend reached its low at SPX 1159. After a four week uptrend, when the market rallied from SPX 1075 to 1293, or 20.3%, a four week 61.8% retracement downtrend followed. Quite frankly, things were not looking too good heading into monday. On monday, however, the market gapped up at the open and never looked back, as the market surged with its best weekly percentage gain since the kickoff rally of the six month July09-Jan10 uptrend. Let’s review the bigger picture to see what this all implies.
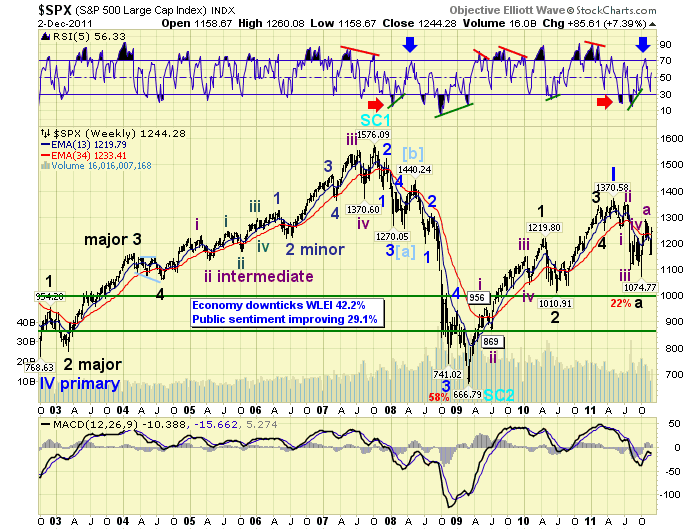
From 2002-2007 the market doubled in a five Major wave bull market, completing Primary wave V of Cycle wave [5] and the Supercycle bull market [SC1] from 1932-2007. Then between 2007-2009 the market lost over 58% of its value in the worse bear market since the 1929-1932 depression. That bear market took of the form of a zigzag (5-3-5) and ended Supercycle wave [SC2]. Some may question this longer term count so let’s put it into perspective. Between 2007-2009 the market corrected a 75 year bull market, (1932-2007), in only 17 months, with a percentage decline of 58%. Historically, the market had also corrected a 200+ year bull market, (1700-1929), in only 34 months, with a 1929-1932 percentage decline of 89%. That bear market ended a 200+ year Grand Supercycle. The 2007-2009 bear market ended a 75 year Supercycle, one lesser degree.
After the Mar09 Supercycle [SC2] low the market advanced in five major waves over 26 months, doubling in value, to kick off Supercycle [SC3]. We have labeled this advance as Primary wave I of a potential 4-5 year Cycle wave [1] bull market. In the spring of this year we had noticed some foreign indices entering bear markets, and some longer term technical indicators also turning bearish. Around June/July we turned long term bearish on the US market expecting it to follow. We posted a “bear market highly probable” next to the Long Term heading, awaiting a long term downtrend confirmation by OEW. The market declined in five waves from May11 to Oct11, and SPX 1371-1075, losing 22% of its value.
A couple of days off that low we identified a diagonal triangle bottom and suggested the market could now rally back to the SPX 1250′s level, or 61.8% retracement of that entire decline. During the next three weeks the market surged to SPX 1293, rising 20.3% in just four weeks. Also, we observed that four week uptrend looked impulsive and not corrective as expected. As a result we switched from long term “bear market highly probable”, (still no OEW long term downtrend confirmation), to long term “neutral”. And, we suggested the 22% correction might have only been Primary wave II of an ongoing 4-5 year Cycle wave [1] bull market. We then carried two counts: a bearish count on the SPX charts, and a bullish count on the DOW charts.
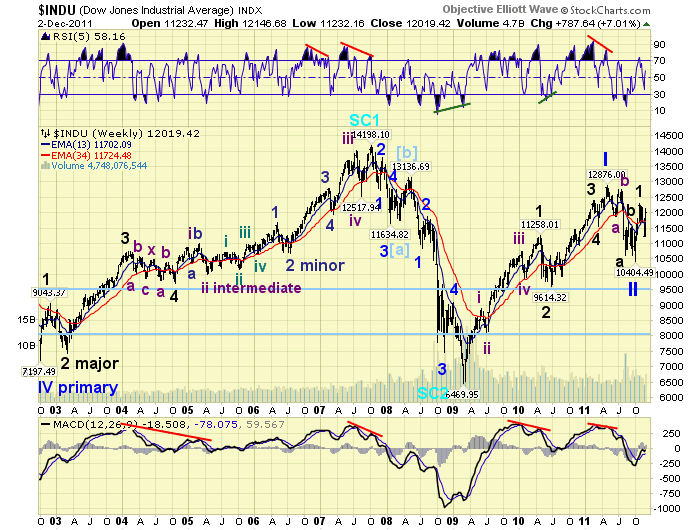
Since bull markets rise in impulsive waves and decline in corrective waves, and bear markets do the reverse. We decided the next downtrend correction off the SPX 1293 high would be the determining factor. Should it be impulsive, the bear market was resuming, and a Long Term “bear market” would be probable. Should it be corrective, the Primary wave II correction was over, and a Long Term “bull market resumes” would be probable. This week the market surged off a corrective downtrend low at SPX 1159. We received a WROC buy signal, which usually precedes an OEW uptrend confirmation, and it has an 88% accuracy rating. This leaves us with an impulsive uptrend from SPX 1075-1293, a potentially completed corrective downtrend from 1293-1159, and now another potential impulsive uptrend from 1159-1260 (friday’s high). This market is starting to look more and more like the resumption of a bull market rather than an ongoing bear market. Keep in mind, OEW never confirmed a long term downtrend in the US while many foreign markets were in confirmed long term downtrends. And, during the 2007-2009 bear market OEW confirmed a long term downtrend less than three months after it started. In conclusion, we have updated the Long Term status: “neutral to bullish” awaiting an uptrend confirmation. When this occurs the count carried on the DOW charts will be the preferred count, and the SPX count will be downgraded to an alternate.
MEDIUM TERM: uptrend likely underway
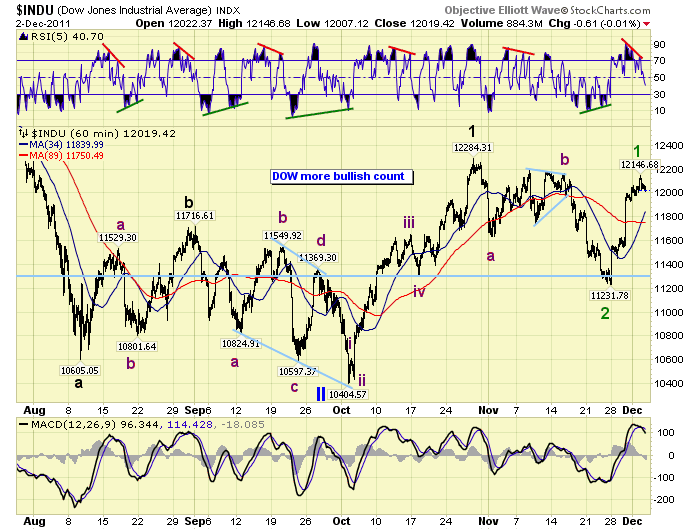
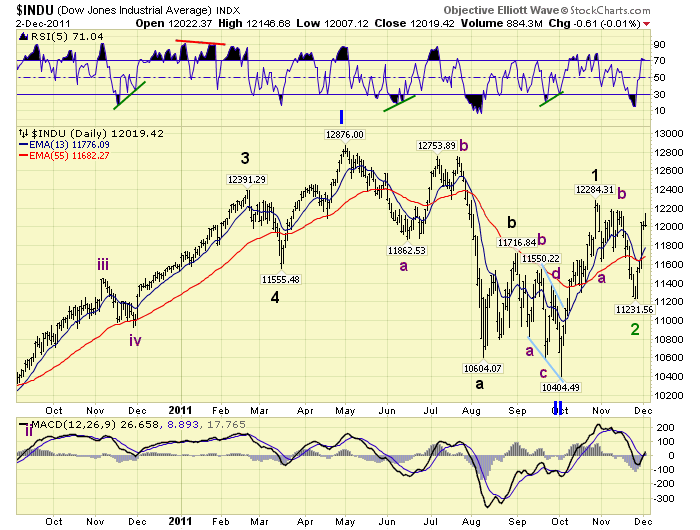
After the SPX 1293 uptrend high the market started losing upside momentum at 1278 and weakened. We counted the decline as either a 1-2-3-4-5 on the SPX charts, or an a-b-c on the DOW charts which was preferred after that impulsive uptrend. While we were awaiting an OEW downtrend confirmation the market declined to SPX 1159 just last friday. This week OEW did confirm that downtrend. After the market gapped up on monday, and consolidated on tuesday, we posted a potential corrective count suggesting the downtrend ended last friday with an ABC, (the B wave being a triangle). The market followed through with another gap up on wednesday and friday, ending the week with higher rally highs each day.
Once this uptrend is confirmed, the market is not that far away from doing just that, the preferred count, as noted above, would be a Primary wave II low at SPX 1075. And, Primary wave III already underway. The first uptrend of Primary III would be Major wave 1 from SPX 1075 to 1293, and the downtrend to SPX 1159 Major wave 2. This uptrend, then, would likely be Intermediate wave one of Major wave 3. To confirm this scenario, other than an uptrend confirmation, we would like to see weekly RSI get quite overbought. Something we have not seen since the Feb11 uptrend high. The weekly RSI gets quite overbought during bull market uptrends, and only barely overbought during bear market uptrends. And, the weekly MACD to rise above neutral which is another bull market trait. Also, we would like to see the monthly RSI substantially clear the neutral zone, and head towards overbought. Another bull market trait.
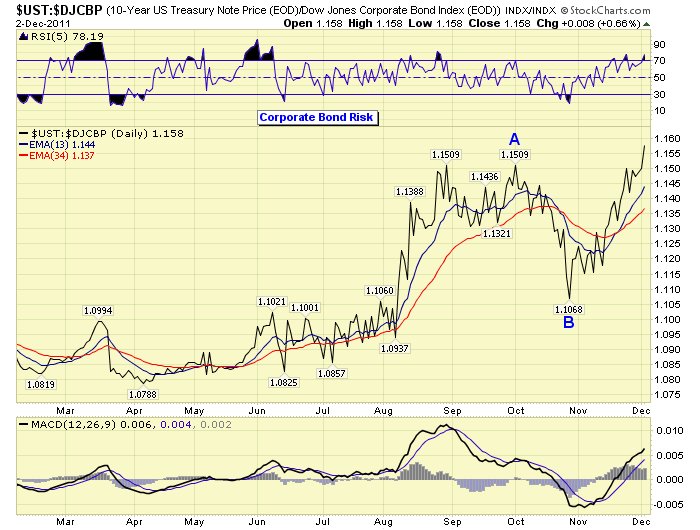
Technically, the market is already displaying improvement. Our DOW momentum indicator has already made a higher high than the October top, and NYAD market breadth has remained in an uptrend since the October low. Three of the nine SPX sectors we track are in confirmed uptrends, and the housing HGX index has also confirmed an uptrend. On the international front five of the twenty indices we track are in confirmed uptrends. The one concern, at this point, is Corporate bond risk continues to rise.
SHORT TERM
Support for the SPX remains at the 1240 and 1222 pivots, with resistance at the 1261 and 1291 pivots. Short term momentum has dropped below neutral on friday, after hitting extremely overbought on wednesday. This week’s rally off the SPX 1159 low looks impulsive. The market has rallied to SPX 1260, (8.7%), in just five trading days. During the previous uptrend the market had rallied from SPX 1075-1195, (11.2%), in five trading days. During that last uptrend the market had six pullbacks of 20+ points each. This potential uptrend, while only a week old, has had four pullbacks of only 10+ points each. Less volatility while maintaining a similar upside momentum trajectory.
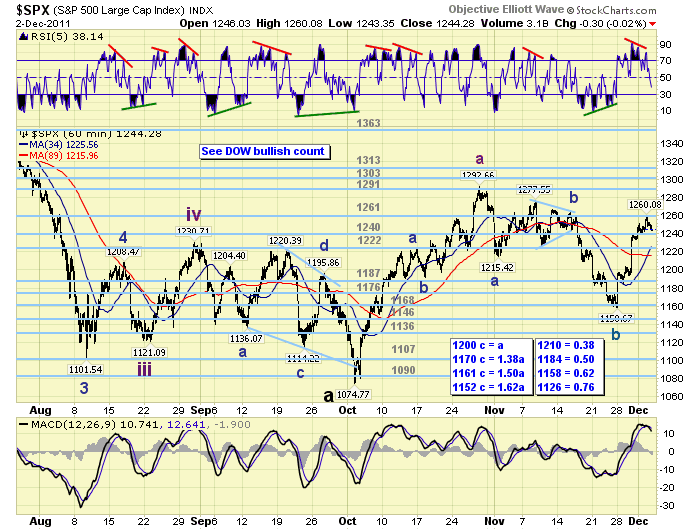
There are two potential counts short term. First, using pullbacks alone, suggests one more higher high before the market has a more substantial pullback. Second, using technicals, suggests the market has just completed the first of five waves up and a more substantial pullback is already underway. We do have a negative RSI divergence on the hourly charts and a weakening MACD from overbought levels. Should the latter be the case, initial support is at the OEW 1240 pivot range (SPX 1233-1247), with more substantial support at the 1222 pivot range (SPX 1215-1229). Short term OEW charts remain positive from monday’s gap up as long as the market holds the SPX upper 1220′s. Best to your trading!
FOREIGN MARKETS
The Asian markets gained 5.9% on the week with only China’s SSEC displaying a loss. Hong Kong and China are in confirmed uptrends.
The European markets gained 9.6% on the week with, often leading indicator, Switzerland in a confirmed uptrend.
The Commodity equity markets gained 7.0% on the week with both Canada and Russia in confirmed uptrends.
The DJ World index gained 8.4% on the week.
COMMODITIES
Bonds continue their uptrend, in narrow trading, losing 0.2% on the week.
Crude continues to uptrend gaining 3.8% on the week.
Gold continues to uptrend gaining 3.9% on the week.
The USD continues to uptrend, as well, but lost 1.3% on the week.
NEXT WEEK
Monday kicks off the economic week with Factory orders and ISM services at 10:00. On wednesday we have Consumer credit. On thursday weekly Jobless claims and Wholesale inventories. Then on friday the Trade deficit and Consumer sentiment. A quiet week economically with all eyes remaining on Europe. The ECB meets on thursday the 8th. Best to your week!
CHARTS: http://stockcharts.com/...
http://caldaroew.spaces.live.com
After about 40 years of investing in the markets one learns that the markets are constantly changing, not only in price, but in what drives the markets. In the 1960s, the Nifty Fifty were the leaders of the stock market. In the 1970s, stock selection using Technical Analysis was important, as the market stayed with a trading range for the entire decade. In the 1980s, the market finally broke out of it doldrums, as the DOW broke through 1100 in 1982, and launched the greatest bull market on record.
Sharing is an important aspect of a life. Over 100 people have joined our group, from all walks of life, covering twenty three countries across the globe. It's been the most fun I have ever had in the market. Sharing uncommon knowledge, with investors. In hope of aiding them in finding their financial independence.
Copyright © 2011 Tony Caldaro - All Rights Reserved Disclaimer: The above is a matter of opinion provided for general information purposes only and is not intended as investment advice. Information and analysis above are derived from sources and utilising methods believed to be reliable, but we cannot accept responsibility for any losses you may incur as a result of this analysis. Individuals should consult with their personal financial advisors.
© 2005-2022 http://www.MarketOracle.co.uk - The Market Oracle is a FREE Daily Financial Markets Analysis & Forecasting online publication.