


Stock Market Wave C Due for a Pause
Stock-Markets / Stock Markets 2011 Dec 05, 2011 - 01:51 AM GMTBy: Andre_Gratian

 SPX: Very Long-term trend - The very-long-term cycles are down and, if they make their lows when expected, there will be another steep and prolonged decline into 2014.
SPX: Intermediate trend - Last week's action suggests that a wave "C" from 1075 is underway.
Analysis of the short-term trend is done on a daily basis with the help of hourly charts. It is an important adjunct to the analysis of daily and weekly charts which discusses the course of longer market trends.
Market Overview
Last week, after meeting its 1160 downside projection, the SPX reversed and soared one hundred points to satisfy an upside phase projection to1260. This should clarify the intermediate market trend; we now know that we have not yet started minor wave 3 of a bear market, but it's too soon to tell if the bull market lives on, or if we are simply doing a C wave to complete minor wave 2.
Whatever it is, if the index can clear 1260 decisively, it should continue at least to beyond the October high of 1292. There are some indications that this won't take place until after there is a correction of a couple of weeks. Cycles in this time frame are combining with resistance at this level to suggest that the advance is due for a pause. After that, the rally can resume and reach at least the low 1300s before the end of what is most likely wave C from 1075. If we are doing something else, it will show up in the market action after we have met the 1314 projection target suggested by the base established on the Point & Figure chart just above 1260.
Chart analysis
We'll start by looking at the Daily Charts of the SPX and the QQQ side by side. At first glance, we can see that, over the longer term, the QQQ is still relatively stronger than the SPX since it is still trading closer to its bull market high than the SPX, but it may be losing some of that relative strength over the short-term. It almost reached the lower channel line during the decline, and its rally was a tad weaker than the SPX. Still, both have essentially the same chart pattern. Last week's rally almost took them out of their correction channels and they are expected to trade around the top trend line for a couple of days before partially falling back within the channels. If they do not show too much weakness over the next two weeks, the rally should resume with a clean break above 1260 for the SPX and 57.50 for the QQQ.
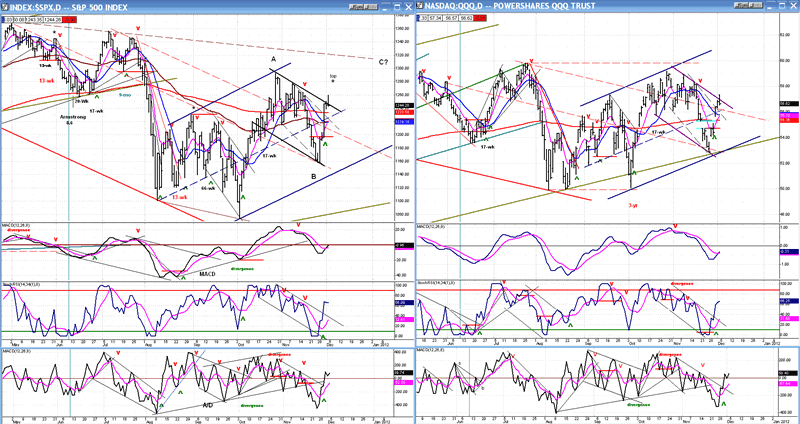
The intermediate uptrend is delineated by the black channel. The green trend line at the bottom of the chart is the long-term lower channel line which goes back to the 2009 low. The QQQ found support on it and even slightly breached it at the October low. When these trend lines are penetrated decisively to the downside, we will know that the bear market has really started.
I am assuming that the October low was the conclusion of minor wave 1 from 1370 on the SPX, and that we have now started wave "C" of minor 2. This is the way it is labeled on the chart. If my projection taken at the 1160 low is valid, wave "C" should end at about 1314. Since the first wave of wave "C" was a 5-wave pattern, we may be looking at another 5-wave pattern to end it, which would make wave "C" a zigzag upward correction.
The EW structure is helpful to clarify the pattern which the index is making, but the indicators are more important because they will alert us to the end of the rally, and the Point & Figure chart has already given us a clue about the extent of wave "C". EW patterns often have a way of evolving into something that you did not expect, so it is best to keep flexible expectations about the potential structure.
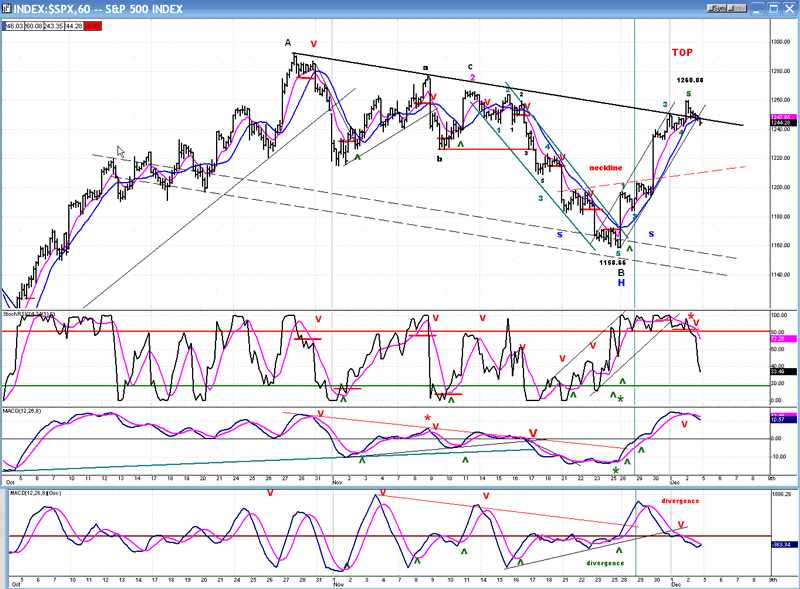
On the SPX, above Friday's bar, I indicated where a near-term top was expected. Friday's action has already begun to confirm this with 5 waves from the low ending in the vicinity of a cycle high. Actually, there are several cycles involved, and they could keep the index in this area for the next couple of days before a deeper retracement begins. This should show up as a distribution pattern on the P&F chart, and give us a good idea of how much of a pull-back wave b (or 2) of "C" should have. Let's go next to the Hourly Chart and have a closer look!
On Friday, the rally apparently completed a 5-wave pattern with the high point slightly above the top trend line. By the end of the day, the index had fallen back below it. The indicators have all rolled over, confirming the end of the trend, and 1260 filled a count taken across a phase of the bottom accumulation pattern, confirmed by a smaller phase of the top pattern.
It is more than likely that we have reached a temporary top, although some distribution may take place at the higher level before the index falls back. This time frame consists of a nest of cycles which extends into Wednesday, so prices may not start retracing until then.
Obviously, the following action of the SPX will have to confirm that we are in wave "C". If we pull-back too much, the rally will become suspicious and we'll have to re-adjust our thinking. I have identified an inverse head & shoulders bottom on the chart; perhaps the retracement will go and touch the extension of the neck line.
Cycles
The 14-15-wk high-to-high cycle which has been so consistent for the past couple of years is expected to make its high early next week. It may already have done so, Friday. If not, it could pull prices back out of the trend line, especially since, this time around, it is part of a small cycle cluster which could have some extended influence on the indices.
Breadth
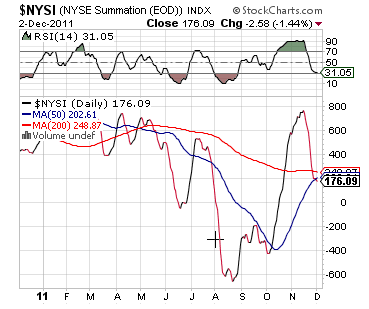
The NYSE Summation Index (courtesy of StockCharts.com) has not acknowledged the rally, and its RSI remains oversold. There was a lot of weakness in the A/D in the drop to 1160 and there have not been enough positive figures to offset it. It will require a little more time for the adjustment to be made.
However, should the NYSI continue to decline, it may be a sign that wave "C" will be truncated and will not achieve its potential count, or that we are doing something other than a zigzag.
Sentiment
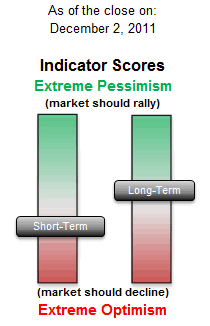
The SentimenTrader (courtesy of same) continues to remain slightly bullish in its long-term index, but the short-term index confirms having reached a potential near-term top.
The total index picture is in sync with my view of the market's position.
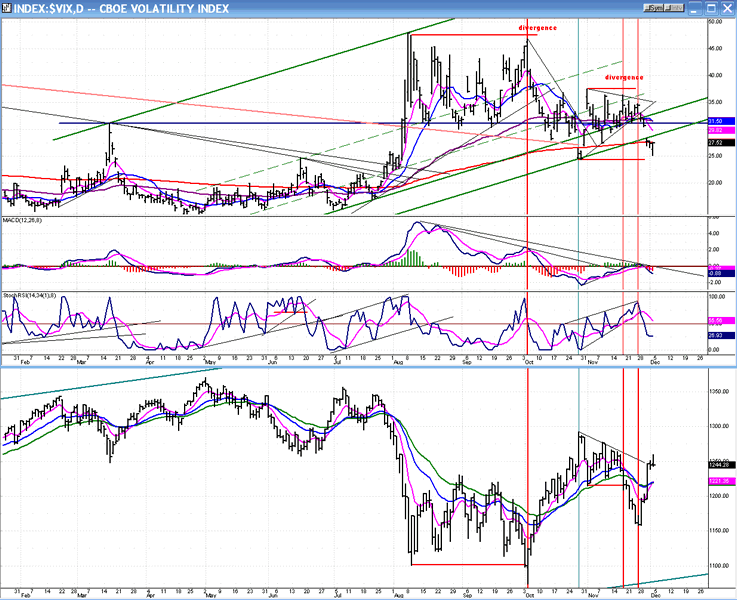
The VIX
This index did a terrific job of warning us about the impending reversal in the market. We are going to continue to keep a close eye on it for the next few weeks to see if it will also be kind enough to warn us of the top. One way to track it is through its indicators. They are currently in a sell mode. When they get ready to give a buy signal, it will be time to look for a top in the market.
On the chart below, you can see that there was some serious negative divergence developing in the MACD in late September. Last week's rally has turned it down again along with the MSO. At some point, both of these indicators will start to exhibit some deceleration and get ready to turn. This is what we must watch for. However this probably won't happen until the lower indicator becomes oversold and the lines are ready to cross. This is not imminent.
BONDS (TLT)
We might as well continue to keep track of all three contrary indicators, although my emphasis is going to be on the VIX.
There are signs that the upward push of wave "C" (if that's what it is) is not going to be nearly as vigorous as that of wave "A". This is reflected in a number of places and one of them is in TLT. Look at the downward momentum which occurred from October 3, and compare it to last week's sell-off, which is much milder.
Nevertheless, TLT has begun to trace out an ABC pattern in reverse to that of the SPX, with the topping pattern of wave "B" projecting a downward target of about 110 for its wave "C".

UUP (Dollar ETF)
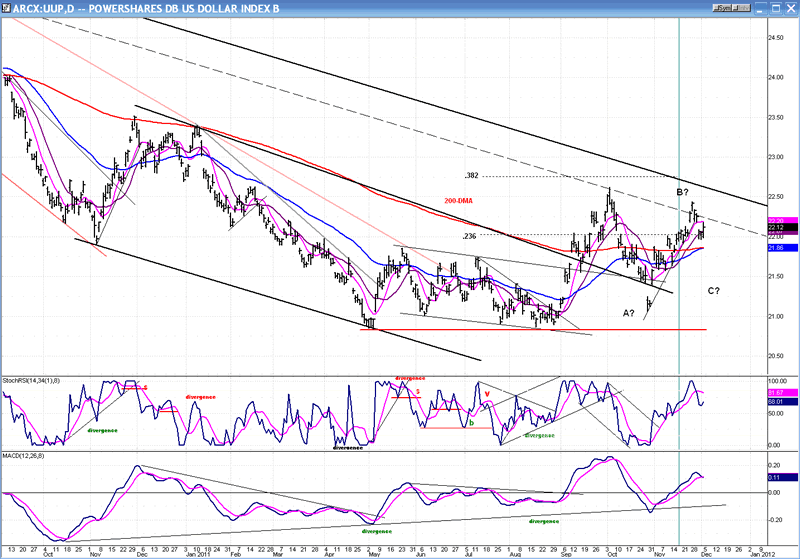
Our third contrary indicator, UUP, has also started to correct in what may also be an A-B-C pattern inverse to that of the SPX. And like TLT, "C" does not have the downward momentum of "A".
With these potential (premature) signs of non-confirmation of the "C" wave, we'll have to keep a close eye on how the market behaves over the next few weeks
Summary
Last week's summary stated that there were signs -- especially in the VIX and TLT -- that we could be witnessing the end of a C wave from 1292, and of a B wave from 1075. There was immediate confirmation of that theory when the markets soared the very next day.
Further confirmation continued as indices kept on rising throughout the week. However, for a wave "C" to be confirmed, the SPX would have to extend its rally past 1292.
A pause is expected to take place this week.
FREE TRIAL SUBSCRIPTON
If precision in market timing for all time frames is something which is important to you, you should consider a trial subscription to my service. It is free, and you will have four weeks to evaluate its worth.
For a FREE 4-week trial. Send an email to: ajg@cybertrails.com
For further subscription options, payment plans, and for important general information, I encourage you to visit my website at www.marketurningpoints.com. It contains summaries of my background, my investment and trading strategies and my unique method of intra-day communication with Market Turning Points subscribers.
By Andre Gratian
MarketTurningPoints.com
A market advisory service should be evaluated on the basis of its forecasting accuracy and cost. At $25.00 per month, this service is probably the best all-around value. Two areas of analysis that are unmatched anywhere else -- cycles (from 2.5-wk to 18-years and longer) and accurate, coordinated Point & Figure and Fibonacci projections -- are combined with other methodologies to bring you weekly reports and frequent daily updates.
“By the Law of Periodical Repetition, everything which has happened once must happen again, and again, and again -- and not capriciously, but at regular periods, and each thing in its own period, not another’s, and each obeying its own law … The same Nature which delights in periodical repetition in the sky is the Nature which orders the affairs of the earth. Let us not underrate the value of that hint.” -- Mark Twain
You may also want to visit the Market Turning Points website to familiarize yourself with my philosophy and strategy.www.marketurningpoints.com
Disclaimer - The above comments about the financial markets are based purely on what I consider to be sound technical analysis principles uncompromised by fundamental considerations. They represent my own opinion and are not meant to be construed as trading or investment advice, but are offered as an analytical point of view which might be of interest to those who follow stock market cycles and technical analysis.
Andre Gratian Archive |
© 2005-2022 http://www.MarketOracle.co.uk - The Market Oracle is a FREE Daily Financial Markets Analysis & Forecasting online publication.