


Silver Ready For Take-Off?
Commodities / Gold and Silver 2011 Dec 05, 2011 - 05:04 AM GMTBy: Willem_Weytjens

 After a very turbulent year, silver now looks set to take off again. In this article I will tell you why I think so.
First of all, let’s look at the Commitment Of Traders reports. Commercials have yet again reduced their Net Short position in Silver, which is now close to the low of 2003 at the beginning of the Bull Market. Commercials are generally seen as the “smart money”, so if they reduce their Net Short Position, they expext price to rise (or at least not drop substantially).
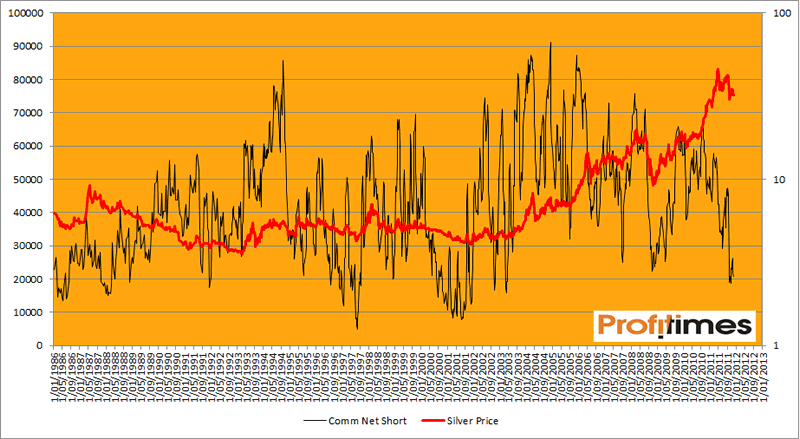
The reason why Commercials are the “Smart Money”, is that – unlike the millions of small investors who burn their hands by buying high and selling low – they tend to “Buy” low (reduce short positions as price declines) and “Sell” high (increase short positions as price rises).
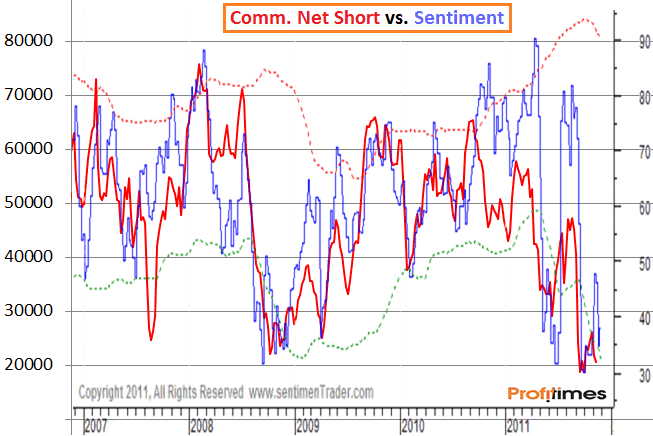
This can be seen in the following chart. There seems to be a very high correlation between the Sentiment charts of Sentimentrader.com and the Net Short Positions of Commercials:
The fact that one should “Buy Low” and “Sell High” is the best way to invest can be seen in the following chart.
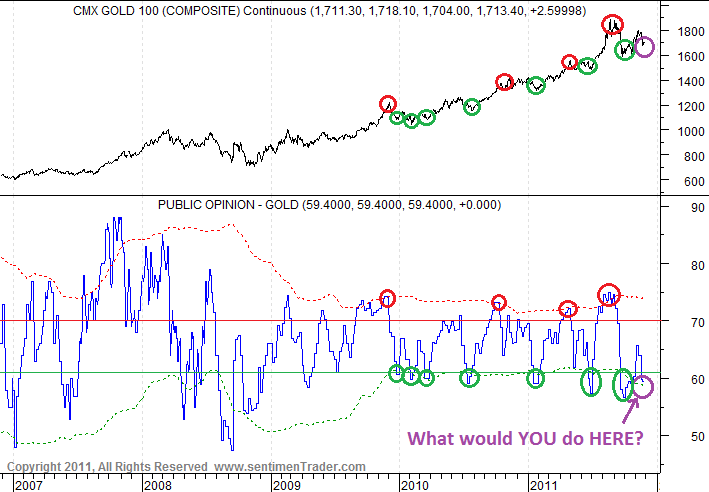
As Sentiment (or Commercials Net Short Positions) climbes into the orange area, it’s time to become cautious. It sure can rise (substantially) higher, but cautiousness is the first step in detecting tops. The second step is to look at perspective. Sentimentrader indicators are overlaid with standard deviation bands that show you how extreme the current reading is compared to its recent history. So if sentiment rises above the red standard deviation band, we know that this is an unsustainable situation, and that sentiment has to reverse (decline) over time.
On the other hand, when sentiment drops below the green standard deviation band, we know that this is also an unsustainable situation, and that sentiment has to reverse (rise) over time.
The red circles on the chart below show that good Exit points occured when sentiment was above the red standard deviation bands.
The green circles on the chart below shows that good Entry points occured when sentiment was below the green standard deviation bands. However, the best entry point of the last 5 years was in 2008. This was a time when both Sentiment and Commercials Net Short positions reached extreme lows. Currently, we are in a similar situation, which could mean that silver is at or at least very close to a bottom, and that it could take off pretty soon…
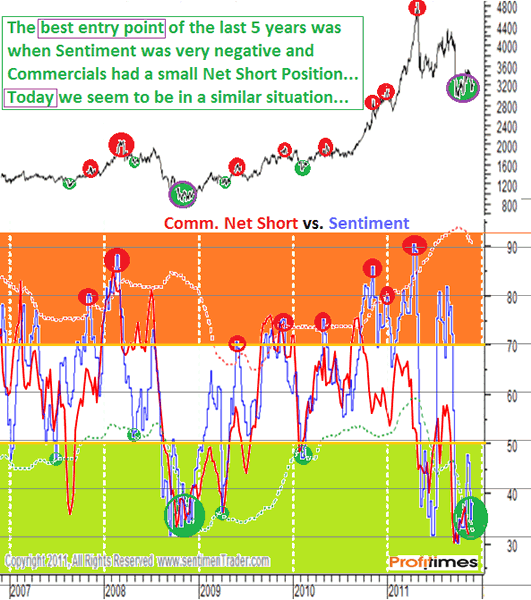
In fact, when we look at the chart below, we might be in an even BETTER position now than in 2008.
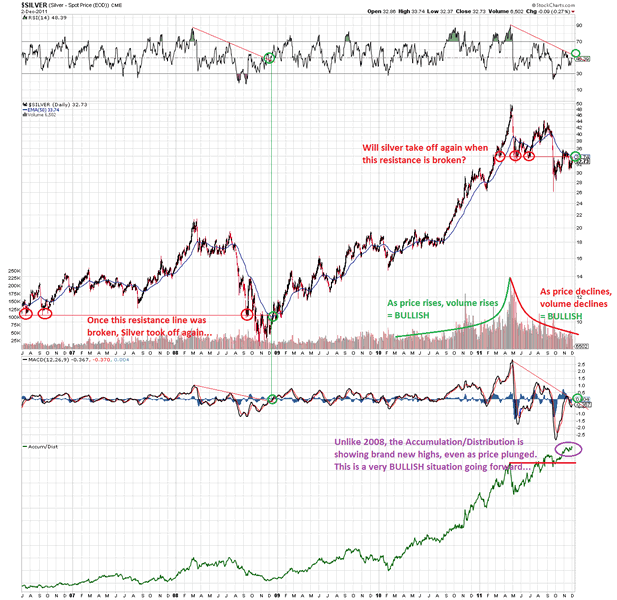
As price declined in 2008, the Accumulation/Distribution index declined as well.
Unlike 2008, the Accumulation/Distribution index has made brand new highs recently, despite the fact that Silver is off about 35% from its all-time high…
Another bullish factor now is that, as price declined, volume declined as well, which was not the case in 2008.
It looks like the massive drop a couple of weeks ago – which took silver down to $26 – was the “perfect” entry point, price wise.
However, in my opinion there are “better” entry points at levels slightly higher than today. Let me explain why.
If you would have bought when silver hit $26, you would have done an AMAZING Job. Congratulations to those who did.
However, if you did, you were catching a falling knife. There was a huge risk that silver would drop even lower, maybe as low as $20, which is about the breakout point of the autumn of 2010.
I personally always look at Risk to Potential Reward. At $26, the risk of Silver dropping another $6.5 was too high for the potential $6.5 I could make. That’s a 1-1 ratio, since you can loose just as much in case you are wrong as you can gain in case you are right.
I like better those kind of situations where you get a risk-reward ratio of 2 -3 (you can gain twice or 3 times as much as you can loose), and I don’t have to think twice when I get a situation that gives me a Risk-Reward ratio of 5.
Look at 2008. As long as price was below the 50EMA, you shouldn’t have bought. The best time to buy in my opinion was early December 2008, when price broke above this 50EMA and both the RSI and MACD broke out above the red resistance lines.
At that point you had a BUY point. You wouldn’t have bought at the extreme lows, but taking this 50EMA as a stoploss, would have minimized your losses, while you could have let your profits run. In fact, this 50EMA was at that point at the same level as the horizontal resistance line underneath the lows of 2006 and September 2008. A breakout above that level was extremely important going forward.
We are currently in a similar position, as there is resistance at $34 which acted as support in the first half of 2011.
The 50EMA is now at the same level as this red resistance line, and both the MACD and RSI look set to brake out above their red resistance lines…
Combine that with the severely depressed sentiment in Silver and the low Net Short Positions of Commercials, and we have the ideal cocktail for a nice rally in silver prices…
Silver tends to follow Gold, so we should also look at sentiment in Gold.
Once again, we can see that the Standard Deviation Bands provide good Entry and Exit points. Sentiment in gold is now pretty bearish, and is close to the green standard deviation band.
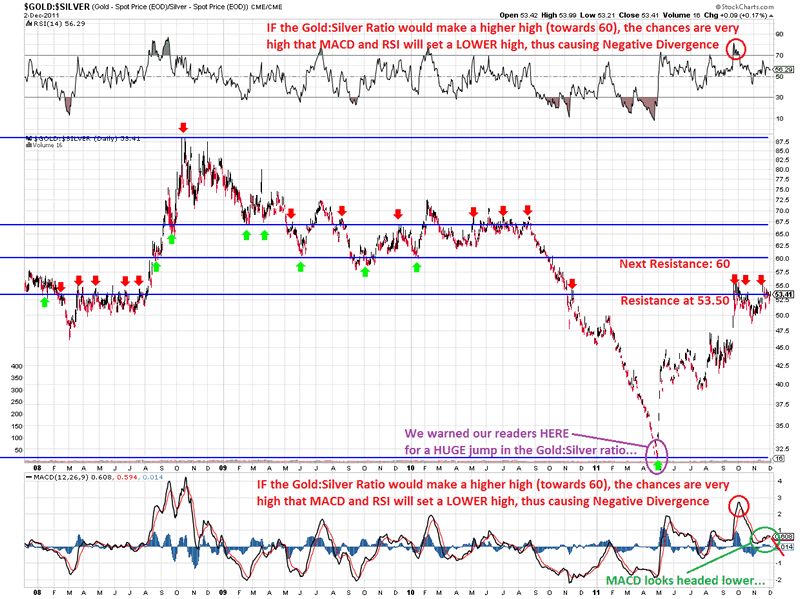
When we look at the Gold:Silver ratio, we can see that the ratio is now facing strong resistance at the 38.20% Fibonacci Level.
IF the ratio would take out this resistance, it looks headed towards 60, which is the 50% Fibonacci Retracement level.
However, if that were to happen, both the RSI and MACD will most likely make a lower high, causing negative divergence, meaning this “rally” should be “sold” (which means one should BUY silver in favor of Gold in my opinion).
The MACD looks set to roll over, which means the ratio looks ready to drop.
Silver is ready for take-off. The question is, ARE YOU?
For more analyses and trading updates, please visit www.profitimes.com
Willem Weytjens
www.profitimes.com
© 2011 Copyright Willem Weytjens - All Rights Reserved
Disclaimer: The above is a matter of opinion provided for general information purposes only and is not intended as investment advice. Information and analysis above are derived from sources and utilising methods believed to be reliable, but we cannot accept responsibility for any losses you may incur as a result of this analysis. Individuals should consult with their personal financial advisors.
© 2005-2022 http://www.MarketOracle.co.uk - The Market Oracle is a FREE Daily Financial Markets Analysis & Forecasting online publication.