


Stock Market Wave2 Complete Giving a Pre Crash Formation
Stock-Markets / Financial Markets 2011 Dec 05, 2011 - 08:29 AM GMT

 -- The VIX deepened its retracement to test daily mid-cycle support at 26.11, then closed above monthly mid-cycle support at 27.30. Short-term, it has lost its daily buy signal as long as it stays below intermediate-term trend support/resistance at 31.25. However, longer-term the VIX remains above critical support and maintains its buy signal on a weekly and monthly basis. It appears that the diamond formation that I had been pointing out the last several weeks has had a false breakout. The cycles, however, point to a higher year-end for the VIX. Perhaps the VIX will meet or exceed the target suggested by the Diamond pattern by year-end.
Wave 2 appears complete…
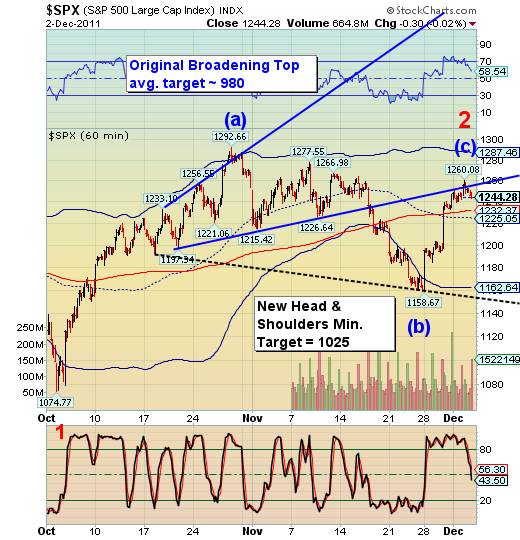
-- The /SPX met its minimum head and shoulders target of 1160.00 that was suggested two weeks ago. However, the bounce is nearly as large as the prior decline. The wave structure in the bounce was impulsive, therefore completing a truncated wave (c). My cycles model anticipated the top closer to 1287.40, but the broadening wedge formation would not allow it. This truncation in the final wave of 2 is extremely bearish.
Today's high may also mark an inverted Trading Cycle high. Last Friday's low appears to mark the end of a Master Cycle, commonly averaging eight months in duration. There is a potential new Head and Shoulders neckline with the minimum target of 1025.00 that appears to reinforce and confirm the original broadening top average target of 980.00. If my assessment is correct, wave 3 may not bottom until the end of January. There is more information to follow on the daily chart.
… Giving us a pre-crash formation.
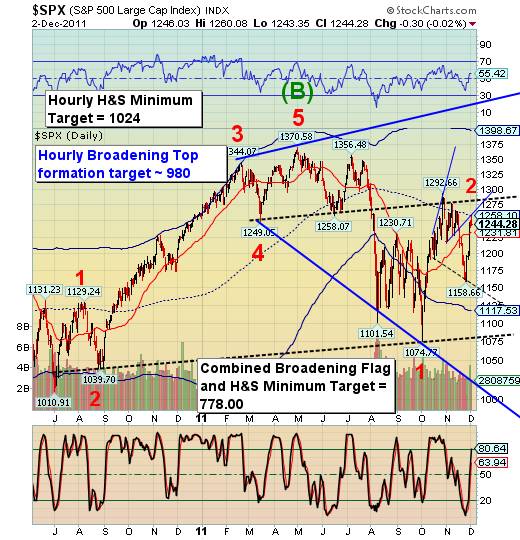
-- The hourly chart targets of 980.00 to 1024.00 implies a potential breakthrough of a much larger Head and Shoulders pattern combined with the Orthodox Broadening Top pattern. The combined targets of these two larger formations appears to be 778.00. Although these patterns are not yet confirmed, the implications of their potential are enormous. Wave 3 may be nearly twice the size of wave 1.
You can see many fractal self-similarities being repeated on the daily chart. As we go from hourly to daily, similar patterns emerge the daily chart shows the up-sloping Head and Shoulders neckline that's similar to the hourly pattern. Thus far, these patterns have proved to be successful in anticipating the market moves.
The Euro approaches its neckline.
.
-- The Euro has bounced off its Head and Shoulders neckline near 132.40, completing a minor retracement. It now appears ready to break its neckline and take a plunge towards parity with the dollar. Since early May the euro has had an increasing correlation with the Standard & Poor's 500 index. There is a strong implication that as the Euro Zone crumbles, so will the financial markets in the United States as well.
Is the US Dollar ready to break out?
-- The dollar appears to have consolidated its gains above its Broadening Formation trendline. It has also challenged its neckline at 79.70. This week it made its final retracement prior to a breakout of its inverted Head and Shoulders pattern. Many technicians look at the lower high as a sign of weakness. However, the Broadening Bottom formation is now confirmed with a very high 98% probability of success in meeting its target. (Source: Encyclopedia of Chart Patterns, by Thomas N. Bulkowski, page 12) The Broadening Bottom minimum gain nicely matches the minimum target for the inverted Head and Shoulders pattern.
Gold reveals a right shoulder.
-- Gold impulsed down into its trading cycle low of 1667.10 on November 21. It appears to have formed a new Head and Shoulders neckline while completing the right shoulder this week. There is a cycle turn in gold this weekend which may cause gold to violate its neckline, setting up a minimum decline to its Orthodox broadening top lower trendline at 1525.00.
The new trading cycle calls for a significant low in gold by the end of December.
U.S. Bonds remain in positive territory.
-- This week USB bounced off intermediate-term trend support at 140.66. Treasury bonds remain on a buy signal and appear oversold enough for a strong reversal. However, I remain neutral, waiting for a breakdown below intermediate-term trend support for a breakout above the prior high. There is enough ambiguity in the chart pattern to make me cautious.
Oil revisits the 100 mark.
--West Texas Crude is made a strong retracement of its decline from the 103.37 high. This weekend is scheduled to be a cycle turn period, where a reversal may have already happened today or could occur on Monday.
For the most part, West Texas crude appears to be correlated with our domestic equities. That suggests that oil may be linked with stocks in a decline lasting possibly three or more weeks, at a minimum. It also appears that oil may be starting a crash pattern along with our domestic equities
China stocks may find support near the October lows.
The Shanghai Index retested, but did not go below the 2307.15 low from the end of October. Earlier, I suggested monitoring the behavior of the Shanghai index while U.S. equities are in full decline. Should support aat 2307.15 hold while our stocks and bonds sell off, it suggests a new “safe haven” for money flows out of the U.S. and Europe
The banking index rallies in a truncated fractal.
The five-day rally in BKX broke back above its intermediate-term trend support/resistance at 38.29. However, the cycle model suggests this rally should have been much larger…to mid-cycle resistance at 43.43. This weekend contains a cycle turn day, which should manifest itself on Monday. A decline back below 38.29 would signal the resumption of the decline and the potential violation of the massive head and shoulders neckline at 32.56.
Good Luck and good trading!
Tony
Our Investment Advisor Registration is on the Web
We are in the process of updating our website at www.thepracticalinvestor.com to have more information on our services. Log on and click on Advisor Registration to get more details.
If you are a client or wish to become one, please make an appointment to discuss our investment strategies by calling Connie or Tony at (517) 699-1554, ext 10 or 11. Or e-mail us at tpi@thepracticalinvestor.com .
Anthony M. Cherniawski, President and CIO http://www.thepracticalinvestor.com
As a State Registered Investment Advisor, The Practical Investor (TPI) manages private client investment portfolios using a proprietary investment strategy created by Chief Investment Officer Tony Cherniawski. Throughout 2000-01, when many investors felt the pain of double digit market losses, TPI successfully navigated the choppy investment waters, creating a profit for our private investment clients. With a focus on preserving assets and capitalizing on opportunities, TPI clients benefited greatly from the TPI strategies, allowing them to stay on track with their life goals
Disclaimer: The content in this article is written for educational and informational purposes only. There is no offer or recommendation to buy or sell any security and no information contained here should be interpreted or construed as investment advice. Do you own due diligence as the information in this article is the opinion of Anthony M. Cherniawski and subject to change without notice.
Anthony M. Cherniawski Archive |
© 2005-2022 http://www.MarketOracle.co.uk - The Market Oracle is a FREE Daily Financial Markets Analysis & Forecasting online publication.