


Gold Model Forecasts $4380 Gold Price
Commodities / Gold and Silver 2011 Dec 12, 2011 - 10:04 AM GMTBy: Willem_Weytjens

 You’ve probably heard it many times: “Gold is a good hedge against inflation”.
But IS it? That’s the question we will try to answer in this article.
Let’s have a look at a chart:
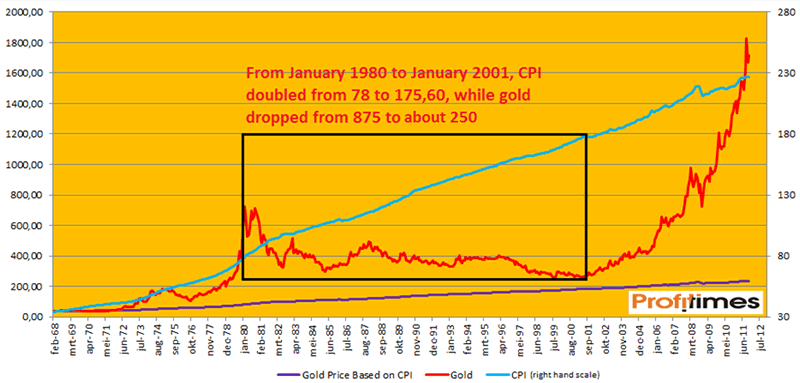
The chart above shows us the gold price (left hand scale, red line) since 1968, when the Gold Pool broke down. At that time, the gold price was no longer fixed, and was able to rise (substantially).
From February 1968 to February 1980, gold rose almost 25-fold, from $35,50 per ounce to as high as $875 per ounce.
From that point, gold started a multi-decade long decline towards $250 per ounce at the beginning of the 21st century. In the same time period, CPI doubled from 78 to 175,60.
From then on, gold rose substantially, from about $250 to $1,920 earlier this year (x7.68), while the CPI rose from 175,60 to 226,42 (only 29%).
So for that matter, it seems there isn’t really a strong correlation between the gold price and the general price level.
I thus figured there had to be other forces at play that influence the price movement of Gold, and yes, I think there are…
Eddy Elfenbein from Crossingwallstreet wrote an article that really intrigued me. He had found a “model” to explain the movements in the Gold price.
He said:
- The first and perhaps the most significant key takeaway is that gold isn’t tied to inflation. It’s tied to low real rates which are often the by-product of inflation.
- The second point is that when real rates are low, the price of gold can rise very, very rapidly.
- The third is that when real rates are high, gold can fall very, very quickly.
Special thanks goes to Jake from EconompicData, who also wrote about this topic, and who has helped me a lot with solving formulas.
So mr. Elfenbein wrote that gold isn’t tied to inflation. It’s tied to low real rates which are often the by-product of inflation (high nominal rates can still lead to low real rates if inflation is also high).
That’s an interesting observation, as Ben Bernanke promised to keep rates at record low levels throughout 2013 in order to stimulate the economy.
When nominal rates are near zero, every bit of inflation we get will lead to negative real yields, causing the gold price to rise substantially over the next two years, according to the model.
I wanted to see it myself, and I was thinking if I could improve the “model”. I think I managed to do so, as my model “gold price” has a higher correlation with the gold price. With a lot of formulas in excel, I calculated the real short term rates, level of inflation, and “calculated” a model price for gold, based on the models of Jake and Eddy.
I didn’t calculate everything manually (I used about 2,000 combinations), but instead worked with a Macro in Excel, which makes my computer do all the work for me.
It took the Macro about 1 hour to calculate every combination of 100 leverage factors and 20 deflator factors.
I found out that a deflator of 2,15% and 2,20% gave the best results, with a leverage between 5.7 and 6.95, instead of the 2% Deflator and 8x leverage as Jake and Eddy found out.
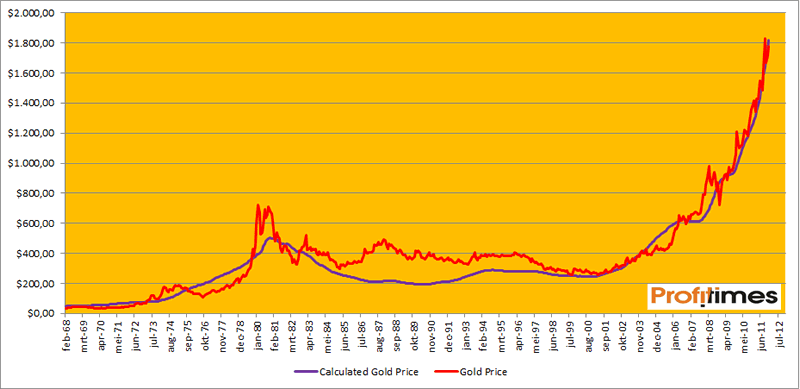
Based on these combinations, I was able to reproduce a “model” price for gold.
The results were rather impressive to say the least. For example, the model price of gold based on a deflator of 2.15% and a leverage factor of 6.90, had a 95.52% correlation with the actual gold price:
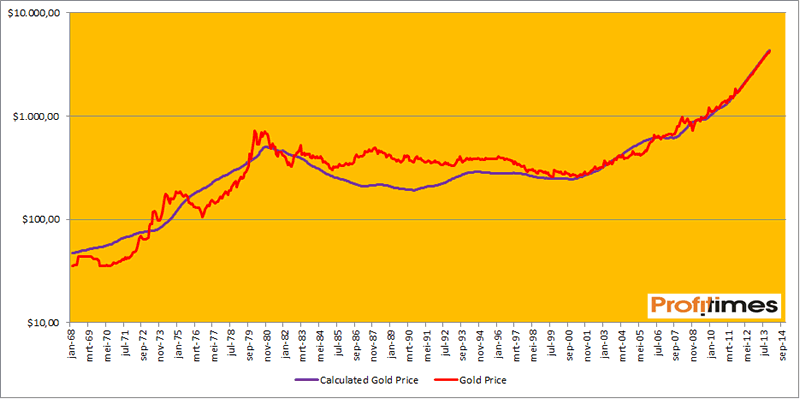
For those who prefer to look at logarithmic charts:
Now, what does this all mean? Does the model have the potential to “forecast” the gold price? Maybe. It depends on the nominal short term rates, and the level of inflation. The first one is pretty easy to “guesstimate”, as Bernanke promised to keep rates near zero for the next 2 years. The average annual (officially reported) rate of inflation over the last 43 years, has been 4.44%.
If we assume we would see a similar rate of inflation over the next 2 years, the Gold model “forecasts” a gold price of $4,380:
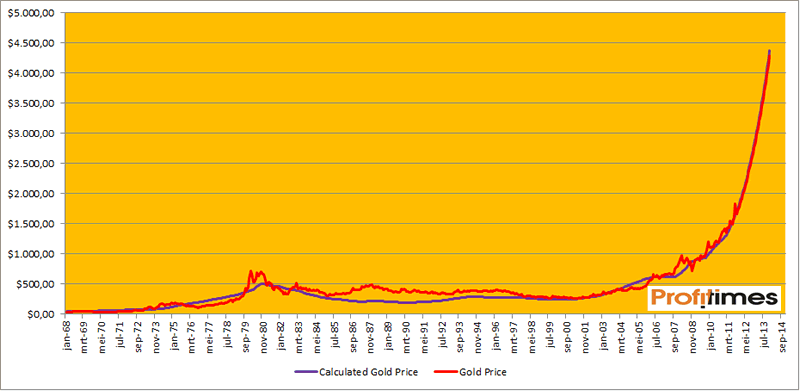
To put things in perspective, please have a look at the logarithmic chart if you think the chart above looks “bubbly”.
From the beginning of this bull market, it would “only” be a 17.5-fold increase, compared to the 25-fold increase from 1968 to 1980. A similar 25-fold increase would lead to a gold price of about $6,250.
We now have another reason to believe legendary gold experts Jim Sinclair, Alf Fields and plenty of other analysts who are fully confident of a parabolic rise in the price of gold with targets of $4,500 and above.
For more analyses, trading updates and interesting articles, please visit www.profitimes.com!
Willem Weytjens
www.profitimes.com
© 2011 Copyright Willem Weytjens - All Rights Reserved
Disclaimer: The above is a matter of opinion provided for general information purposes only and is not intended as investment advice. Information and analysis above are derived from sources and utilising methods believed to be reliable, but we cannot accept responsibility for any losses you may incur as a result of this analysis. Individuals should consult with their personal financial advisors.
© 2005-2022 http://www.MarketOracle.co.uk - The Market Oracle is a FREE Daily Financial Markets Analysis & Forecasting online publication.