


Gold Strongly Bullish Going into 2008
Commodities / Gold & Silver Dec 30, 2007 - 06:44 PM GMTBy: Merv_Burak

Boy, you take a few days off and all hell breaks loose. Gold seems ready for new highs and the US $ for new lows. Let's take a quick look.
U.S. Dollar Index
No fundamental stuff here, just the facts. Let's take a little tour as to where the $ has been and see if there is any indication of it coming to a halt anytime soon.
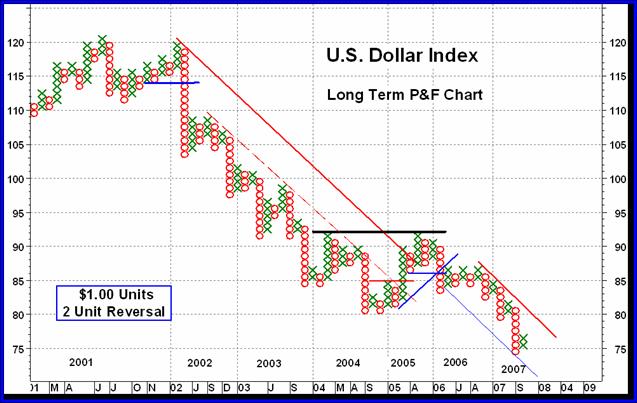
First, the $ made a major down side break in early 2002 at the 114 level. By a horizontal count this gave us a price projection to 85. At the time most people would not have believed it but by late 2003/early2004 there it was. It then tried to stabilize but by late 2004 it was on the move again, downward. Although there was no reversal of trend the lateral activity was enough to give us a new down side projection. This time it was to the 74 level, and here it is. Well, not quite 74.00 but it's not finished yet. In late 2004 it bottomed out and started a new rally. This time it did give us a reversal signal with a 93 projection but couldn't quite get through the previous rally high (now a resistance) at 92. We then got a new reversal back to the down side and a new projection, this time down to the 54 level. This 54 projection was again obtained when the $ made a new low at the 80 mark in 2007.
Now, people might not believe THAT projection but there you are, 54 two different times. Is this all nothing but playing with Xs and Os and having fun or is there something behind these charts and projections? Hell if I know, I just know that they work often enough not to laugh them off BUT also not to accept the projections as gospel and let the ongoing technical market activity be my primary guide. By the way, time is not a factor in P&F analysis so there is no way, from this chart, to know if the projection will be met this coming year or in 5 years.
GOLD : LONG TERM
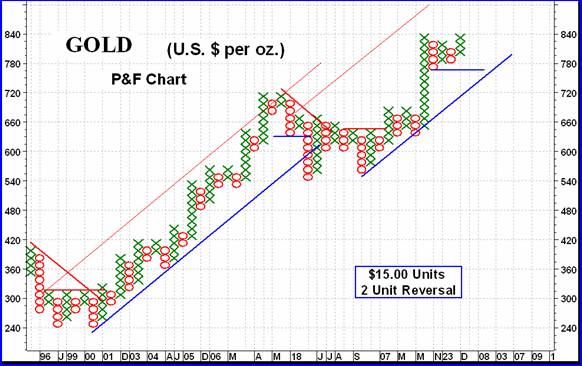
This still being the Christmas/New Year season I will simplify this week's commentary and you can't get any more simple than a P&F chart. The long term chart shown is now up against its previous 2007 high and ready for more upside. A new high will require a move to the $855 level, about $10 above Friday's close. As mentioned in the 30 Nov 2007 commentary, the next projected levels are $915 and then $1125. Unless that up trend line is breached, those are the levels to watch.
As for the usual suspects, The Index is still above its positive moving average line and the momentum remains in its positive zone. All is BULLISH on the long term.
INTERMEDIATE TERM
Gold closed on Friday just about $4 short of a new yearly high. The price action during the week was impressive but the momentum and volume were not. It just might be the holiday season with most traders away from the market action and just taking a week or two off. We'll see what happens next week, after the New Year. For now the Index has broken through the previous megaphone pattern on the up side and continues above its positive moving average line. Momentum is positive but very sadly lagging the price action. The volume indicator is also sadly lagging and may still be considered as in the negative zone. However, with traders away for the holidays this is to be expected and one should not put too much emphasis on the volume action this time of year.
On the intermediate term I am upgrading my rating for now to + NEUTRAL , one level short of a bullish rating. If the trend continues that rating will likely go bullish next week.
SHORT TERM
With the upside break of the megaphone pattern, short term wise we are on a roll. As mentioned above, the only cautionary emphasis is the lack of volume over the past few days but that should change as soon as Wednesday, or at the latest, Thursday comes around.
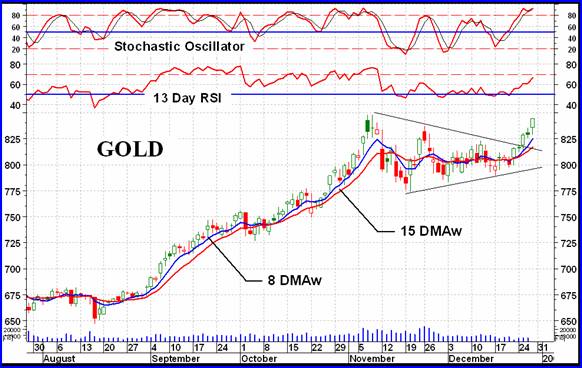
On the break the two moving averages, the short term (15 DMAw) and the very short term (8 DMAw) started to spread apart. For the first time in the past few weeks they are now comfortably apart and following the price of gold on the up side. The short term momentum (13 Day RSI) is also perking up. The more aggressive Stochastic Oscillator is now inside its overbought zone and leveling off. The short term can be rated as BULLISH . A move below $825 in the next few trading sessions might indicate the end of the positive move but let's wait for it. It just might not get here.
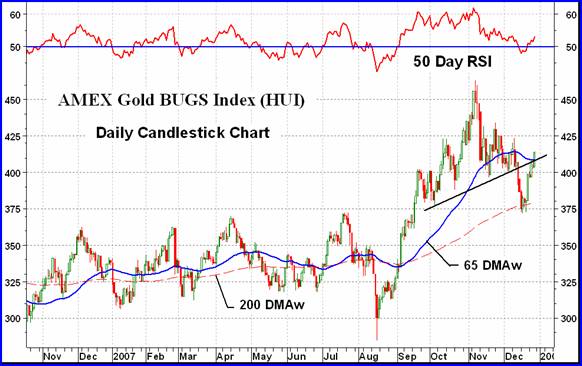
NORTH AMERICAN GOLD INDICES
During most of 2007 the AMEX Gold BUGS Index moved sideways. Then in mid-August it took off for a two and a half month rally. That was it until this past week, when it seemed to be once more preparing for a new rally, to new highs. However, its move has been underwhelming versus that of gold itself. Gold is just a few $ short of a new high while the AMEX Gold BUGS Index is still closer to its recent lows. One might suspect that this is just a rally back to the head and shoulder neckline, which often occurs after a neckline break. We shall see over the next few trading days what goes. There is another difference between the gold price and the major gold Indices. Although gold has now passed its mid-Nov to mid-Dec highs none of the major Indices has yet done so. They are all lagging the movement in the gold price. This is disconcerting as it is the Indices that are the normal leading indicators of a new move, not the lagging indicators. The problem with this lagging effect may be that the Indices fell far lower than did the price of gold, relative to their previous moves, and that they now have to move so much higher just to get back to where they were.
Having said all that as cautionary, the Index is now above its moving average line and the line has just turned upwards. Momentum has also just moved into its positive zone. So, one must go with an intermediate term BULLISH rating at this time.
MERV'S PRECIOUS METALS INDICES
It was a generally good week all around for the precious metals. The overall Composite Index of Precious Metals Indices gained 3.8%, which is one of the better percentage gains in several weeks. All of the precious metals Indices were higher, including gold and silver bullion BUT the US $ was the only loser of the bunch with a loss of 2.0% on the week. Both the intermediate and long term moving averages are positive as are the two momentum indicators. Overall, the Precious Metals are still in a BULLISH mode.
MERV'S GOLD & SILVER 160 INDEX
All of the various Indices are positive, now how are the stocks themselves doing?
The universe of 160 stocks gained an average of 4.1%. This was okay but just a little less than the major North American Indices which averaged 4.7% gain. Their slightly better performance was due to the higher weighting of the largest stocks, which had very good weeks. Along with the weekly Index gain we had a good breadth as far as the number of stocks actually gaining versus those losing ground on the week. There were 123 gainers (77%) and only 28 losers (18%), the rest were unchanged. Despite the positive weekly action there were no stocks making spectacular gains (or loses) during the week.
The moves were quite relaxed which shows no panic buying yet. The moves were in the right direction and resulted in the summation of individual stock ratings to move higher. The short term rating is now at a BULL 57%, however the other ratings have not yet crossed over into the positive. The intermediate term rating is at BEAR 58% and the long term is at a NEUTRAL rating with neither bull nor bear in control. We need another week or two of good upside action to get these summation of ratings into the bullish camp.
As for the charts and indicators, they are somewhat mixed. The weekly gain was great but it was only one week. Although the Index closed just slightly above its long term moving average line it was still below its intermediate one. Both lines are still pointing downward so we still need a little more upside action to turn things around. The momentum indicators have inched their way just above their neutral line into the positive zone. All in all I would rate the intermediate and long term as NEUTRAL pending the turning up of the moving average lines.
MERV'S QUAL-GOLD INDEX : MERV'S SPEC-GOLD INDEX : MERV'S GAMB-GOLD INDEX
Once again we have the weekly performance reflecting the quality of the stocks. The Qual-Gold gained 4.1%, the Spec-Gold gained 3.3% and the Gamb-Gold gained 3.2%. On an individual performance 90% of the Qual stocks moved higher while only 73% of the Spec and 63% of the Gamb stocks did so. AS for the summation of individual technical ratings, on the short term the Qual is at BULL 68%, the Spec is at BULL 68% and the Gamb is at NEUTRAL. On the intermediate term the Qual is at NEUTRAL, the Spec is at BEAR 60% and the Gamb is at BEAR 62%. On the long term the Qual is at BULL 72%, the Spec is at NEUTRAL and the Gamb is at BULL 67%.
Looking over the charts and indicators all three sector Indices are BULLISH on the long term and + NEUTRAL on the intermediate term.
SILVER
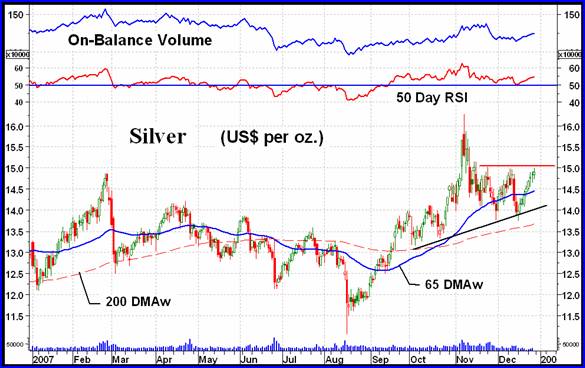
During most of the year silver was in a gentle downward drift then in mid-August it took off along with gold. Two and a half months later it went into a slump and only now looks like it wants to get out of it. The weekly move was not as good as for gold but still the price moved above its positive intermediate term moving average line (it already was above its long term line). Both momentum indicators (intermediate and long term) are in their positive zones and moving upward. All seems well with silver BUT there is that resistance at the $15.05 level that has to be breached. That might come on Monday or after the New Year. We still have an upward sloping head and shoulder pattern but it looks like that pattern will be nullified if silver continues its climb. Let's wait and see what the coming week will bring. Despite the indicated resistance both time periods, intermediate and long term, are considered BULLISH by the indicators.
MERV'S QUAL-SILVER INDEX : MERV'S SPEC-SILVER INDEX
Both Indices had a good week but unlike the Gold sector Indices the Qual-Silver took a back seat to the Spec-Silver Index. The Qual gained 3.9% while the Spec gained 4.4%. Despite the lower % move all of the Qual component stocks moved higher while only 72% of the Spec stocks did. As for the summation of individual technical ratings, on the short term the Qual has a BULL 60% rating while the Spec has a NEUTRAL rating. On the intermediate term it's Qual with a BEAR 50% and the Spec with a BEAR 66% rating. On the long term it's Qual with a BULL 50% and the Spec with a BEAR 50% rating.
Looking at the charts and indicators, we get an interesting difference between the two Indices. The Qual Index is above both its moving average lines and both momentum indicators are positive. The Spec Index is below both of its moving average lines and both momentum indicators are still negative. So, the Qual-Silver Index is rated as BULLISH for both time periods while the Spec-Silver Index is rated as BEARISH for both.
Next week we have a comparison as how the various Table Indices did during the year and also for several other time periods.
Merv's Precious Metals Indices Table
That's it for today.
Have a SAFE NEW YEAR'S celebration.
By Merv Burak, CMT
Hudson Aero/Systems Inc.
Technical Information Group
for Merv's Precious Metals Central
Web: www.themarkettraders.com
e-mail: merv@themarkettraders.com
Before you invest, Always check your market timing with a Qualified Professional Market Technician
For DAILY Uranium stock commentary and WEEKLY Uranium market update check out my new Technically Uranium with Merv blog at www.techuranium.blogspot.com .
During the day Merv practices his engineering profession as a Consulting Aerospace Engineer. Once the sun goes down and night descends upon the earth Merv dons his other hat as a Chartered Market Technician ( CMT ) and tries to decipher what's going on in the securities markets. As an underground surveyor in the gold mines of Canada 's Northwest Territories in his youth, Merv has a soft spot for the gold industry and has developed several Gold Indices reflecting different aspects of the industry. As a basically lazy individual Merv's driving focus is to KEEP IT SIMPLE .
To find out more about Merv's various Gold Indices and component stocks, please visit www.themarkettraders.com and click on Merv's Precious Metals Central . There you will find samples of the Indices and their component stocks plus other publications of interest to gold investors. While at the themarkettraders.com web site please take the time to check out the Energy Central site and the various Merv's Energy Tables for the most comprehensive survey of energy stocks on the internet. Before you invest, Always check your market timing with a Qualified Professional Market Technician
Merv Burak Archive |
© 2005-2022 http://www.MarketOracle.co.uk - The Market Oracle is a FREE Daily Financial Markets Analysis & Forecasting online publication.