


Stock Market Ready to Rally
Stock-Markets / Stock Markets 2011 Dec 19, 2011 - 04:00 AM GMTBy: Andre_Gratian

 SPX: Very Long-term trend - The very-long-term cycles are down and, if they make their lows when expected, there will be another steep and prolonged decline into 2014.
SPX: Intermediate trend - The current action suggests that a wave "C" from 1075 is underway and, after a short consolidation, is about to resume its uptrend.
Analysis of the short-term trend is done on a daily basis with the help of hourly charts. It is an important adjunct to the analysis of daily and weekly charts which discusses the course of longer market trends.
Market Overview
Last week, the headline was: "A LITTLE MORE CONSOLIDATION?", which turned out to be correct with the SPX losing another 45 points before finding support.
What now? Last week's prediction was predicated on cycles bottoming early next week. These cycles exerted steady pressure during the beginning of the week, but by Thursday, the SPX was starting to resist the downtrend, and this was the case on Friday as well. One reason for this action was the fact that the P&F chart had given a phase count to 1212. On Thursday, the SPX found support just below the projection target at 1210, re-tested it, and held above that level for the rest of the week.
Although this may suggest that a correction low has been made, what is more likely is that the total distribution phase count to about 1205 will be met, with the possibility of a further decline to 1195. Since cycles are due to bottom early next week, this makes more sense than forming a base above 1210.
Should this take place, the market would then be in a position to extend the wave "C" rally which started at 1159. It may have only a limited time window to do so. According to Raymond Merriman, the renown financial astrologer, astrological signs will become unfavorable to the stock market by the end of the month. Since the SPX will have to travel 90 to 100 points just to get to the former 1292 high, if he is right, it will be a challenge to do so in such a short amount of time.
On the other hand, astrology aside, the technical picture of the SPX looks favorable. As you will see on the chart, the index may be in the process of making a significant inverted Head & Shoulders pattern which would be confirmed if it can rise above 1267. Next week, if the base pattern is complete and the SPX has reversed, we can gauge by the size of the base how far the rally can travel. Previous projections have suggested about 1314, and even higher. That will be confirmed (or not) by the base pattern which is currently under construction. At this point, it looks as if the SPX will have to hold off reversing until about the middle of next week so that the accumulation pattern can be extended enough to confirm the former projections.
Chart analysis
Let's look at the market position as of Friday's close to see where we stand technically. Since we are trying to de-cypher what will take place over the next few days, we'll start with the Hourly Chart which is the crystal ball better suited for this time frame.
I have drawn all the important support and resistance lines, channels, etc... and will discuss each one and its relevance to the current trend. Starting with the longer-term trend, there is a (red) declining trend line from the 1356 high and drawn across the 1292 top which stopped the rally from 1159, and which is now the make-or-break trend line for the coming rally. If the uptrend which is about to start cannot rise above this trend line, the concept of wave "C" could be in serious trouble.
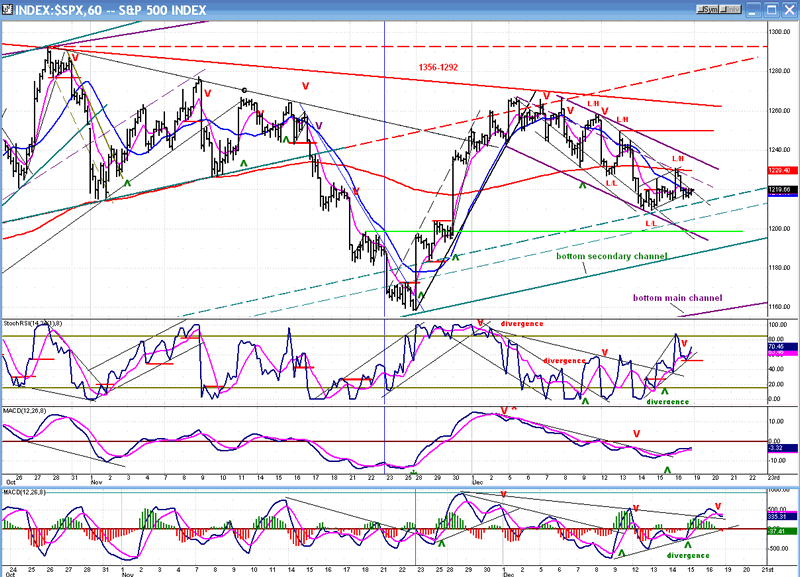
Even if SPX does make it through the declining trend line, it will face more formidable resistance a little higher.
Before going into that, let's bring our attention to the various up-channels. There are two main ones which encompass the intermediate uptrend, the (purple) main channel, and the (green) secondary channel. The secondary channel has provided support for the 1159 low and, more recently, its (dashed) parallel has provided temporary support for the current decline from 1267. Since we expect a slightly lower low, it will most likely be broken and prices may find support on the next lower parallel. But this is not what concerns us right now. The red (dashed) trend line above the price pattern is also a parallel to the secondary channel, and it acted as a support line before the decline to 1159, as well as a resistance line for the rally from that level.
The point that I am making is that, even if the SPX can overcome the (red) declining trend line from 1356 to 1292, it will immediately find more resistance just a few points higher, and the level where that up-trending, red-dashed line meets the dashed line drawn across the 1292 top will be practically impossible to penetrate without further consolidation. This does not bode well for the rally extending all the way to the 1314 projection. On the other hand, if the SPX can cut through all this overhead resistance without pausing, it will be a sign that we have a strong market on our hands!
Now, let's shift our attention to the short-term trend from 1267. Here, the trend is in a tight declining (purple) channel. At first glance, it's obvious that we are not quite ready to reverse. Within the purple channel, there is a steeper channel. For the first time since the decline started, the index challenged that secondary channel, but was pushed back before it even came close to the top purple downtrend line. Also, the fact that prices traveled all the way down to the lower purple line is a sign that the decline lacks the deceleration pattern which precedes a reversal. The rally from Thursday, was only an oversold rally from a decline to the 1212 projection. In that process, the indicators became overbought and will have to move back to the bottom again as prices find their final price objective. This may take more than one or two days.
Let's now take a brief look at the Daily Chart to see how all this looks on that time scale.
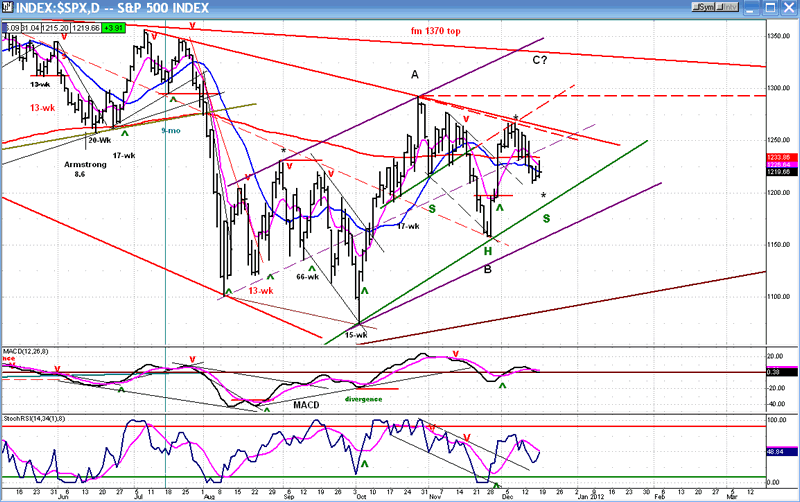
Because prices are compressed on this chart, making a new high above 1292 does not look as formidable as it did on the hourly chart. Furthermore, there is an inverse H&S pattern which appears to be forming on the index. In order to confirm it, the SPX will have to rise above 1267, which is above the red downtrend line from 1356. Will the Santa Rally have enough oomph to do that? The next couple of weeks promise to be very interesting.
Cycles
The main cycle keeping prices down until next week is the 11-wk cycle. That's all that comes to mind for the rest of the year. I will discuss those bottoming in January in the next letter.
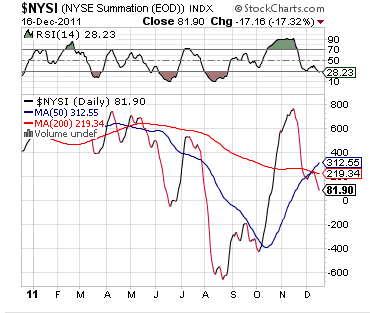
Breadth
The Summation Index (courtesy StockCharts.com) resumed its downtrend along with the 10-day correction and made a new low. This may not have any immediate repercussion on the market, but it is a sign that there may not be much strength ahead. All the more reason to be alert toward the end of the month.
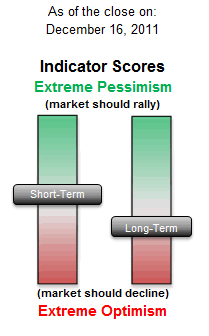
Sentiment
The SentimenTrader (courtesy of same) remains 2/3 negative on the long term. Should it continue to drop further into the red, it will add to the other warnings that beginning to appear elsewhere.
The VIX
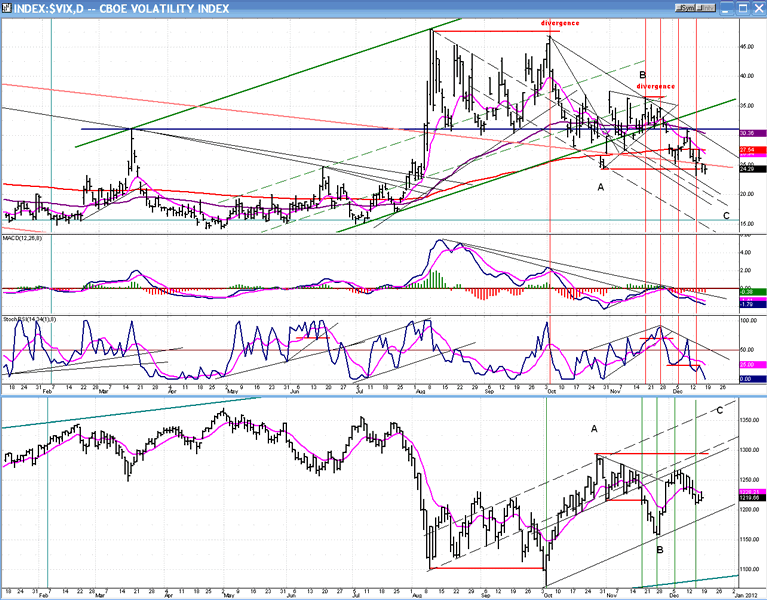
The VIX continues to decline along with the SPX, whereby it should be going in the other direction. The only way I can interpret this action is that it is bullish for equities.
This index, like the SPX, appears to be in a Large A-B-C consolidation, a corrective wave which puts it in an intermediate downtrend. It also appears to have farther to go on the downside. The indicators are in a decline and there is not sign of a low appearing in them.
The P&F chart calls for the VIX to reach about 21 before its decline ends. There could also be a period of base building while the indicators work themselves in a reversal position. This should give the SPX time to complete its "C" wave.
BONDS (TLT)
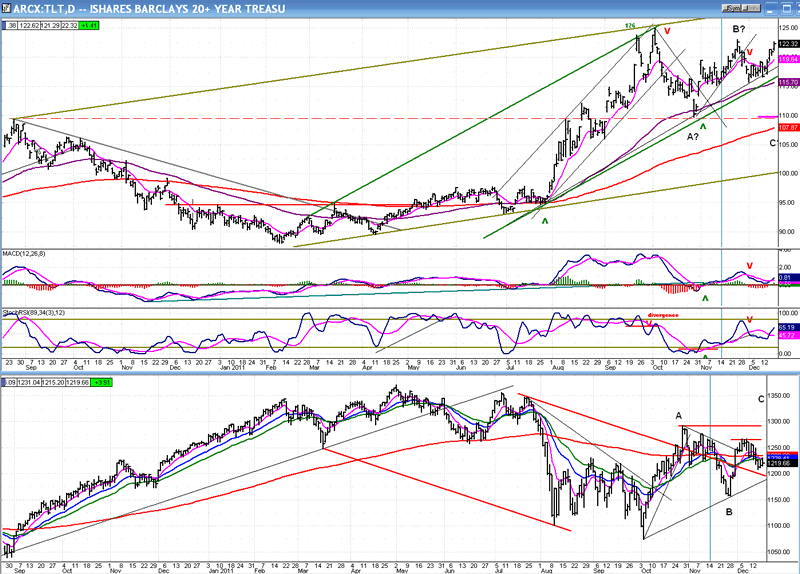
TLT is doing a better job than VIX in moving against the SPX. It has kept on rising as the equity indices have continued to correct. Also, as opposed to the VIX, it is showing more strength than the SPX is showing weakness.
According to its P&F chart, TLT should double-top at 123-124. It closed above 122 on Friday and should reach its final near-term high next week as the SPX completes its correction.
UUP (Dollar ETF)
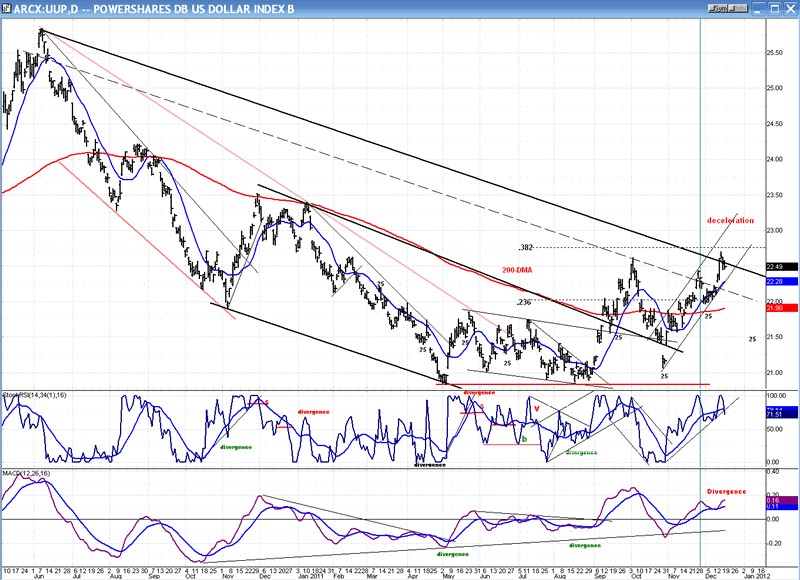
UUP's attempt to push through its long-term downtrend line looks premature. It has already been pushed back, and the indicators are beginning to roll over after the MACD showed some obvious negative divergence.
Another factor to consider is that there is a regular 25-day cycle which appears to control the index, and it may have made its top and be ready to bring about a decline into early January.
UUP does have a P&F projection to about 22.80, so it may have one more little upward thrust before giving up. This would be in sync with a final low for the SPX correction.
GLD (GOLD ETF)
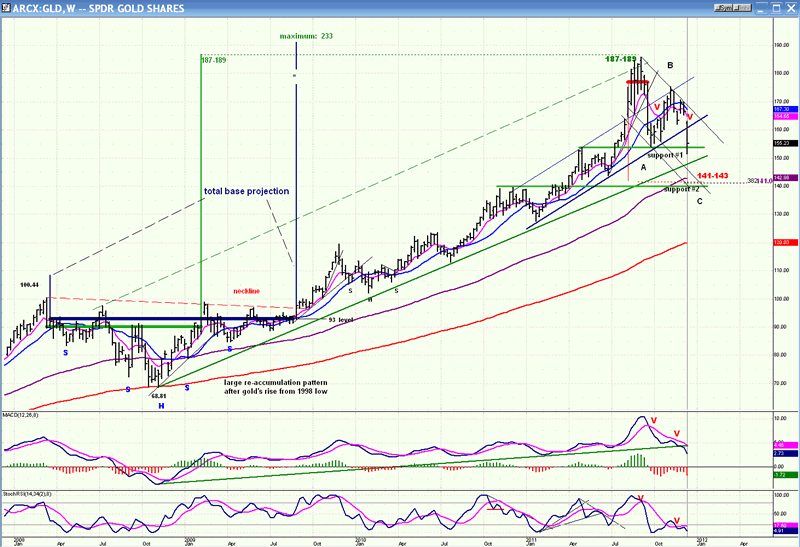
I have been suggesting for several weeks that GLD may be entering an intermediate correction. Actually, this started three months ago after a climactic move which almost reached the important projection target of 187-189.
The following Weekly Chart of GLD shows that the price actually peaked at 185.85, where heavy selling took place, sending the index into an immediate 32-point plunge to the nearest support level. This turned out to be wave A of the largest corrective pattern for GLD since October 2008, and it was followed by a wave B retracement of about 61.8 of the decline.
GLD has now started wave C which has already violated the low of A and, according to the P&F chart, seems destined to continue down to 141-143 which, in all likelihood, will be the end of wave C. However, there is the possibility of an extension of the correction down to 134.
One should make sure that GLD is only making a corrective wave, and is not engaged in a long-term correction. By dropping to 134 after failing to hold 141, GLD would muddy the analytic water.
A higher potential count (to 233) derived from the P&F chart suggests that what we are seeing is only a much needed intermediate correction.
Summary
As anticipated, the market has continued to correct, but it is now approaching a potentially important reversal point: the resumption of the wave "C" rally.
From a cyclic and technical viewpoint, another short decline appears to be needed to conclude the corrective pattern. This could take place early next week and be complete by Tuesday or Wednesday. The total base which will have been formed by then should give us a good idea about how much of rally to expect.
FREE TRIAL SUBSCRIPTON
If precision in market timing for all time frames is something which is important to you, you should consider a trial subscription to my service. It is free, and you will have four weeks to evaluate its worth.
For a FREE 4-week trial. Send an email to: ajg@cybertrails.com
For further subscription options, payment plans, and for important general information, I encourage you to visit my website at www.marketurningpoints.com. It contains summaries of my background, my investment and trading strategies and my unique method of intra-day communication with Market Turning Points subscribers.
By Andre Gratian
MarketTurningPoints.com
A market advisory service should be evaluated on the basis of its forecasting accuracy and cost. At $25.00 per month, this service is probably the best all-around value. Two areas of analysis that are unmatched anywhere else -- cycles (from 2.5-wk to 18-years and longer) and accurate, coordinated Point & Figure and Fibonacci projections -- are combined with other methodologies to bring you weekly reports and frequent daily updates.
“By the Law of Periodical Repetition, everything which has happened once must happen again, and again, and again -- and not capriciously, but at regular periods, and each thing in its own period, not another’s, and each obeying its own law … The same Nature which delights in periodical repetition in the sky is the Nature which orders the affairs of the earth. Let us not underrate the value of that hint.” -- Mark Twain
You may also want to visit the Market Turning Points website to familiarize yourself with my philosophy and strategy.www.marketurningpoints.com
Disclaimer - The above comments about the financial markets are based purely on what I consider to be sound technical analysis principles uncompromised by fundamental considerations. They represent my own opinion and are not meant to be construed as trading or investment advice, but are offered as an analytical point of view which might be of interest to those who follow stock market cycles and technical analysis.
Andre Gratian Archive |
© 2005-2022 http://www.MarketOracle.co.uk - The Market Oracle is a FREE Daily Financial Markets Analysis & Forecasting online publication.