Get Ready for Another Stock Market Plunge!
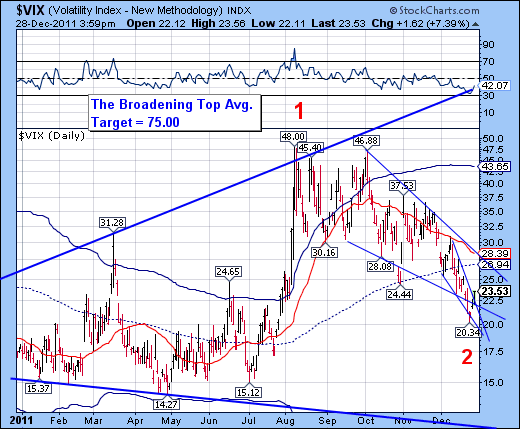
Stock-Markets / Stock Markets 2011 Dec 29, 2011 - 01:36 AM GMT The VIX has staged a breakout of its smaller Ending Diagonal Formation, but is still underneath mid-cycle support/resistance at 26.94 and the upper trendline of its larger Declining Wedge formation. The VIX is posing a challenge to the equities markets again. My best interpretation of the cycles is that the VIX may be challenging the upper trendline of the Declining Wedge formation by the end of this week.
Once it is above mid-cycle support/resistance, it will also be above weekly mid-cycle support/resistance as well, putting the VIX on a buy signal at all degrees of trend.
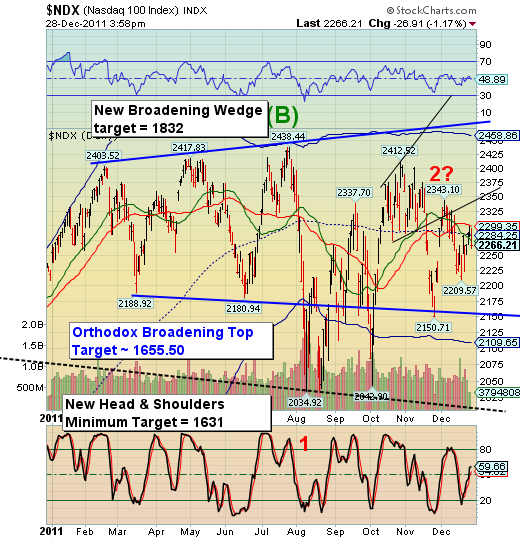
The NDX was stopped at its 50 day moving average at 2299.35 and is now below mid-cycle resistance at 2284.25. It has just recently crossed intermediate-term trend support/resistance at 2278.35 as well. You will note the bearish cross of the green intermediate-term trend line beneath the red 50 day moving average in December. We not only have the bearish cross of the moving averages but also a decline below mid-cycle support/resistance to give us a doubly indicated sell signal in the NDX. The five down – three up wave pattern is a classic reversal that cannot be ignored.
The bottom trendline of the Orthodox Broadening Top at 2150.00 may no longer be capable of affording support in this decline. Instead, it may double as a potential neckline for a small head and shoulders pattern with the minimum target near 1950.00. This will most certainly activate the much larger head and shoulders neckline near 2000.00. This carries the head and shoulders minimum target of 1631.00 that I have had notated on this chart since October.
In other words, the NDX may be about to be launched into an 800 point free-fall through the end of January.
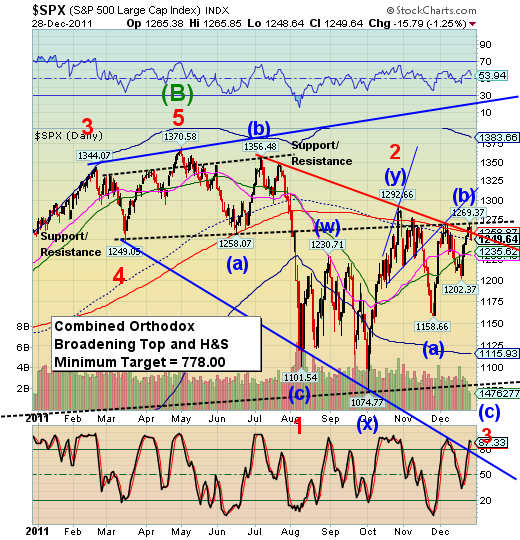
The SPX closed just beneath the 200 day moving average at 1258.87 and mid-cycle support/resistance at 1249.79. This constitutes a cyclical sell signal for the SPX. In addition, intermediate-term trend support/resistance has dropped below the 50 day moving average at 1235.62 giving the SPX a moving average sell signal as well.
The SPX is at risk of a crash beginning with this overnight session. Don't expect either of the lower moving averages to hold at this time. I expect the combined Orthodox Broadening Top and Head and Shoulders minimum target of 778.00 to be met or exceeded by the last week of January. This appears to be a deadly combination since the Head and Shoulders pattern has a 94% accuracy, while the Orthodox Broadening Top has a 96% accuracy rate. Based on the Broadening Top pattern, the SPX is now in its crash phase.
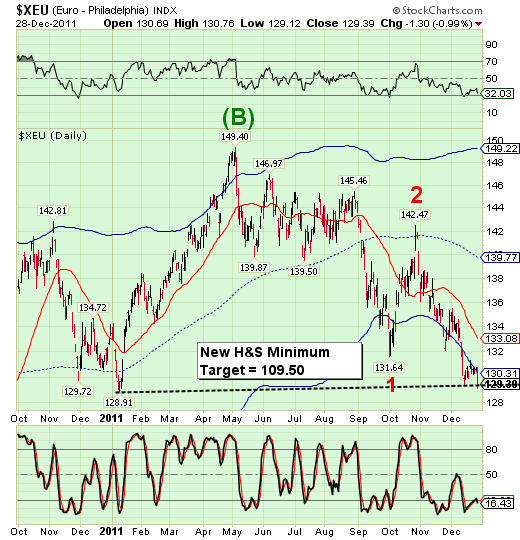
The Euro may have created a new head and shoulders neckline at 129.45 last week and today it closed beneath it, triggering a massive sell signal that is likely to end near parity with the dollar.
An alternate view may be that the euro has set a cyclical low today, creating a new neckline at today's low of 129.12, instead. If so, there may be a brief spike back to 133.08 over the New Year's holiday, then the resumption of the decline into the end of January.
In either situation, the XEU is in for some tough business ahead.
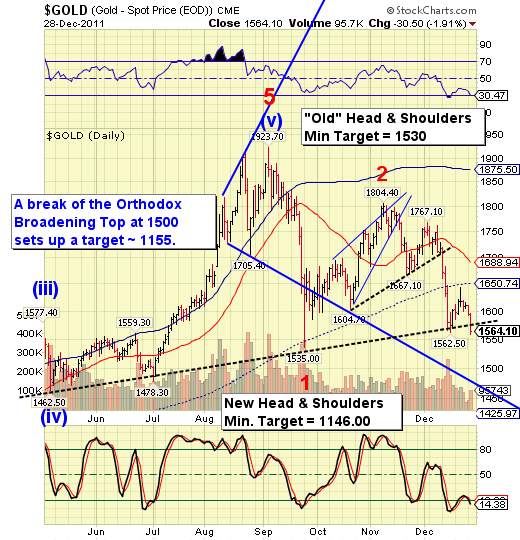
Today gold violated its massive Head and Shoulders neckline with the minimum target near 1150.00. This may also be accomplished by the end of January. The expected scenario is typical of "a third of a third wave".
I expect this decline to accelerate shortly. The overnight futures have already declined to 1550.00. The crash phase of this Orthodox Broadening Top may be in full swing.
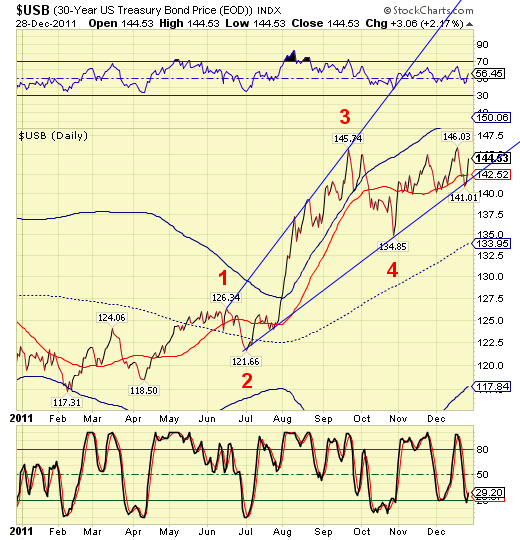
USB has resumed its uptrend since its trading cycle low last Thursday. The next target is a primary cycle high due on January 21. I have no idea how high this will go, except for the fact that cycle top resistance is at 150.06 and breakthrough of that resistance is inevitable. It may be quite a ride!
Good luck and good trading!
Regards,
Tony
Our Investment Advisor Registration is on the Web
We are in the process of updating our website at www.thepracticalinvestor.com to have more information on our services. Log on and click on Advisor Registration to get more details.
If you are a client or wish to become one, please make an appointment to discuss our investment strategies by calling Connie or Tony at (517) 699-1554, ext 10 or 11. Or e-mail us at tpi@thepracticalinvestor.com .
Anthony M. Cherniawski, President and CIO http://www.thepracticalinvestor.com
As a State Registered Investment Advisor, The Practical Investor (TPI) manages private client investment portfolios using a proprietary investment strategy created by Chief Investment Officer Tony Cherniawski. Throughout 2000-01, when many investors felt the pain of double digit market losses, TPI successfully navigated the choppy investment waters, creating a profit for our private investment clients. With a focus on preserving assets and capitalizing on opportunities, TPI clients benefited greatly from the TPI strategies, allowing them to stay on track with their life goals
Disclaimer: The content in this article is written for educational and informational purposes only. There is no offer or recommendation to buy or sell any security and no information contained here should be interpreted or construed as investment advice. Do you own due diligence as the information in this article is the opinion of Anthony M. Cherniawski and subject to change without notice.
Anthony M. Cherniawski Archive |
© 2005-2022 http://www.MarketOracle.co.uk - The Market Oracle is a FREE Daily Financial Markets Analysis & Forecasting online publication.


