


Gold’s D-Wave Downtrend Forecast for 2012 Confirmed
Commodities / Gold and Silver 2012 Dec 29, 2011 - 11:39 AM GMTBy: Toby_Connor

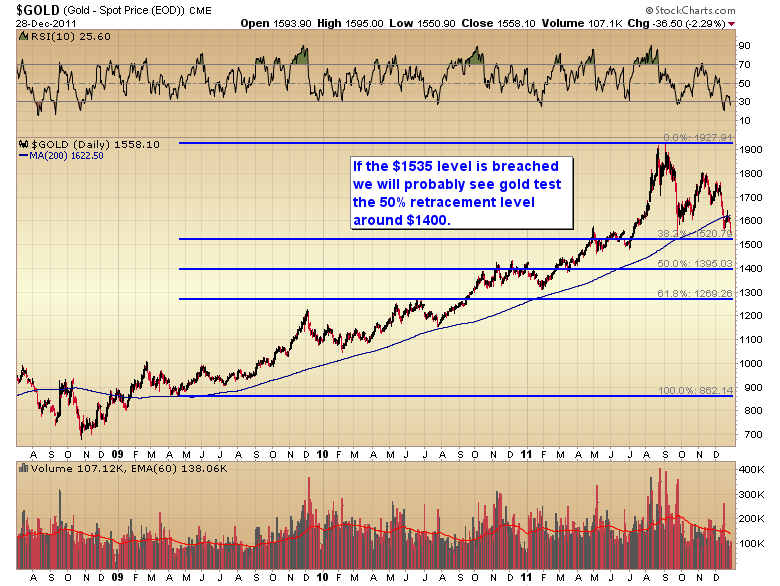
 With the move below $1535 this morning gold has confirmed that it is still moving down into a D-Wave bottom. There has been some question as to whether or not the D-Wave had bottomed in September. The penetration of that intermediate low this morning confirms that the D-Wave did not end during the overnight selloff on September 26.
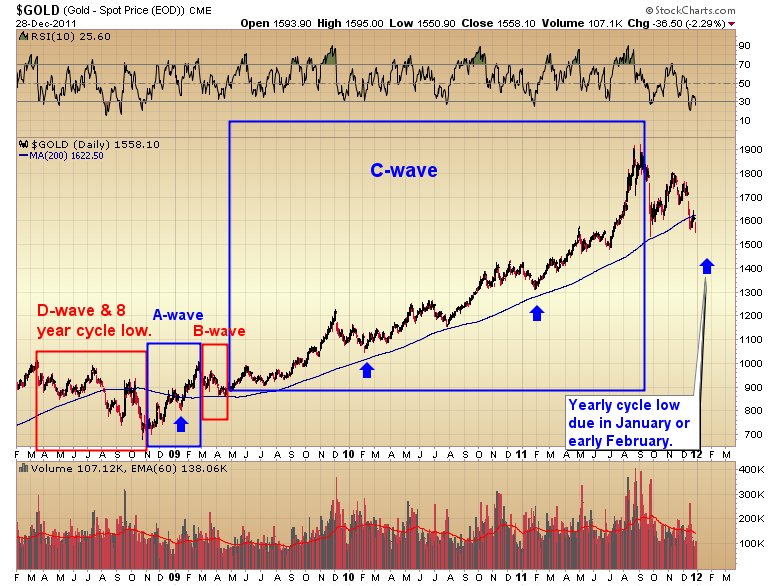
In the chart below I have marked with blue arrows the last several yearly cycle lows. As you can see they tend to occur in January or February. The timing band for the next cycle low should occur sometime in early to mid January. That should mark the bottom of this D-Wave decline with the slight possibility that there could be one more short daily cycle down, bottoming in early February. This will almost certainly be dependent on whether the dollar cycle has one or two more daily cycles higher before rolling over into an intermediate decline. Current sentiment levels on the dollar index are suggesting only one daily cycle higher, which should signal a final bottom in the gold market sometime in the next 2-3 weeks.
If gold can make it back to the 50% retracement in the next couple of weeks I would probably be inclined to call a yearly cycle low at that point. If however gold holds above $1500 at the next daily cycle low due in early to mid-January then I would be wary of one more daily cycle down to test the 2010 consolidation zone and 50% retracement ($1400) sometime in early February.
The combination of the dollar rally out of its three year cycle low, gold's yearly cycle low, and a D-Wave decline are going to produce a very sharp correction in the gold bull market. Before this is over most analysts will declare the gold bull dead. On the contrary, sometime early next year you are going to get the single best buying opportunity we will ever have to reenter the secular gold bull in preparation for the bubble phase that should top in late 2014 or early 2015.
As a matter of fact, now that we have confirmed that this is an ongoing D-Wave decline, once its bottom has formed it will generate a violent A-Wave advance that should test the $1800 - $1900 level rather quickly later this spring.
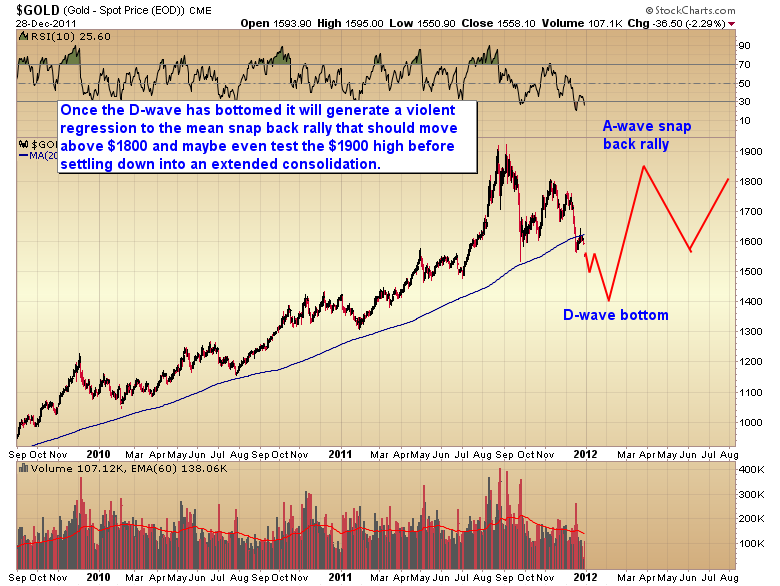
Serious money will be made during the A-Wave advance. One just needs the patience to wait for the D-Wave to bottom before jumping back into the pool.
Click here to go to the premium website then click on the subscribe link on the right-hand side of the page. You will see the special offer at the bottom of the subscription page.
Toby Connor
Gold Scents
GoldScents is a financial blog focused on the analysis of the stock market and the secular gold bull market. Subscriptions to the premium service includes a daily and weekend market update emailed to subscribers. If you would like to be added to the email list that receives notice of new posts to GoldScents, or have questions,email Toby.
© 2011 Copyright Toby Connor - All Rights Reserved
Disclaimer: The above is a matter of opinion provided for general information purposes only and is not intended as investment advice. Information and analysis above are derived from sources and utilising methods believed to be reliable, but we cannot accept responsibility for any losses you may incur as a result of this analysis. Individuals should consult with their personal financial advisors.
© 2005-2022 http://www.MarketOracle.co.uk - The Market Oracle is a FREE Daily Financial Markets Analysis & Forecasting online publication.