


Cause and Effect, the Stock Market Is Not Physics
InvestorEducation / Learning to Invest Dec 29, 2011 - 12:02 PM GMTBy: EWI

 The following series is excerpted from two classic issues of Robert Prechter's Elliott Wave Theorist. Although originally published in 2004, the valuable series has been re-released in the Independent Investor eBook, along with over 100 pages of other reports that challenge conventional economic thinking.
Here is Part III of the series. You can read Part I and Part II here. Check back in a few days to read Part IV, or you can download your free copy of the Independent Investor eBook here.
Cause and Effect In the 1990s, a university professor sold many books that made a case for buying "stocks for the long run." In a recent issue of USA Today, he told a reporter, "Clearly, the risk of terror is the major reason why the markets have come down. We can't quantify these risks; it's not like flipping a coin and knowing your odds are 50-50 that an attack won't occur."1
In other words, he accepts the physics paradigm of external cause and effect with respect to the stock market but says he cannot predict the cause part of the equation and therefore cannot predict stock prices. The first question is, well, if one cannot predict causes, then how can one write a book predicting effects, i.e., arguing that stocks will go up? Or down or sideways? A second question is far more important. We have already seen that economic performance, earnings and inflation do not necessarily coincide with movements in apparently related financial markets. In fact, the two sets of data can utterly oppose each other. Is there any evidence that dramatic news events that make headlines, such as terrorist attacks, political events, wars, crises or any such events are causal to stock market movement?
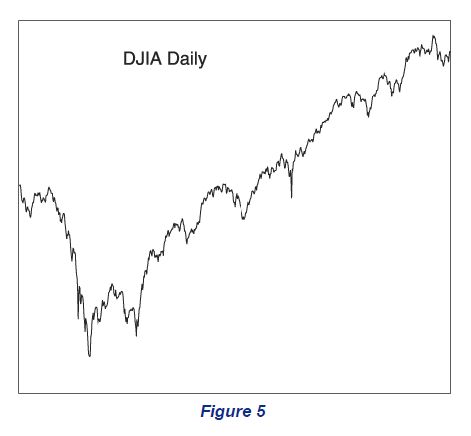
Suppose the devil were to offer you historic news a day in advance. He doesn't even ask for your soul in exchange. He explains, "What's more, you can hold a position for as little as a single trading day after the event or as long as you like." It sounds foolproof, so you accept. His first offer: "The president will be assassinated tomorrow." You can't believe it. You and only you know it's going to happen. The devil transports you back to November 22, 1963. You short the market. Do you make money?
Figure 5 shows the DJIA around the time when President John Kennedy was shot. First of all, can you tell by looking at the graph exactly when that event occurred? Maybe before that big drop on the left? Maybe at some other peak, causing a selloff?
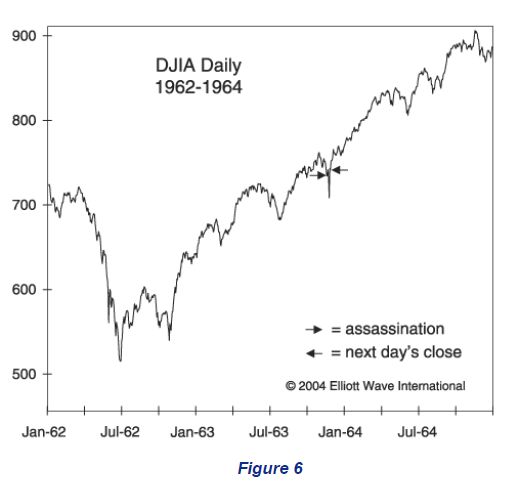
The first arrow in Figure 6 shows the timing of the assassination. The market initially fell, but by the close of the next trading day, it was above where it was at the moment of the event, as you can see by the second arrow. You can't cover your short sales until the following day's up opening because the devil said that you could hold as briefly as one trading day after the event, but not less. You lose money.
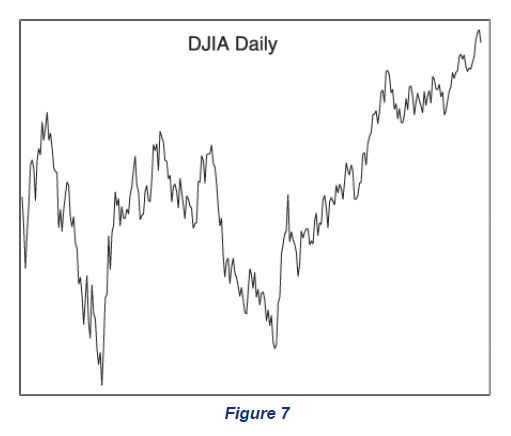
You aren't really angry because after all, the devil delivered on his promise. Your only error was to believe that a presidential assassination would dictate the course of stock prices. So you vow not to bet on things that aren't directly related to finance. The devil pops up again, and you explain what you want. "I've got just the thing," he says, and announces, "The biggest electrical blackout in the history of North America will occur tomorrow." Wow. Billions of dollars of lost production. People stranded in subways and elevators. The last time a blackout occurred, there was a riot in New York and hundreds of millions of dollars' worth of damage done. How more directly related to finance could you get? "Sold!" you cry. The devil transports you back to August 2003.
Figure 7 shows the DJIA around the time of the blackout. Does the history of stock prices make it evident when that event occurred? After all, if markets are action and reaction, then this economic loss should show up unmistakably, shouldn't it? There are two big drops on the graph. Maybe it's one of them.
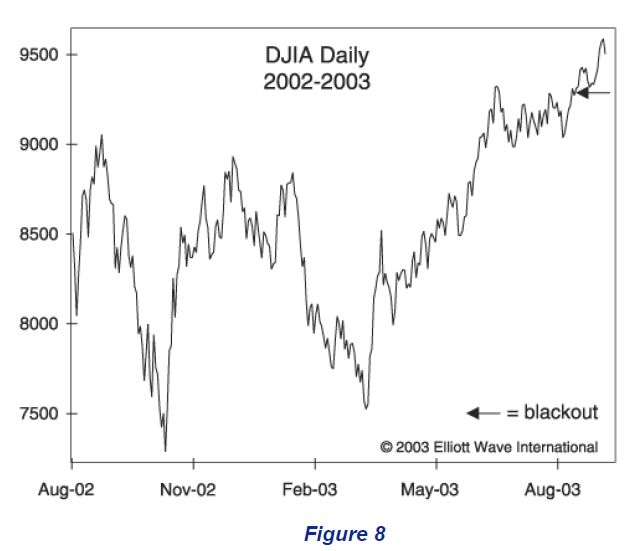
The arrow in Figure 8 shows the timing of that event. Not only did the market fail to collapse, it gapped up the next morning! You sit all day with your short sales and cover the following day with another loss.
"Third time's the charm," says the devil. You reply, "Forget it. I don't understand why the market isn't reacting to these causes. Maybe these events you're giving me just aren't strong enough." The devil leans into your ear and whispers, "Two bombs will be detonated in London, leveling landmark buildings and killing 3000 people. Another bomb planted at Parliament will misfire, merely blowing the side off the building. The terrorist perpetrators will vow to continue their attacks until England is wiped out." He promises that you can sell short on the London Stock Exchange ten minutes before it happens and even offers to remove the one-day holding restriction. "Cover whenever you like," he says. You agree. The devil then transports you to a parallel universe where London is New York and Parliament is the Pentagon. It's September 11, 2001.
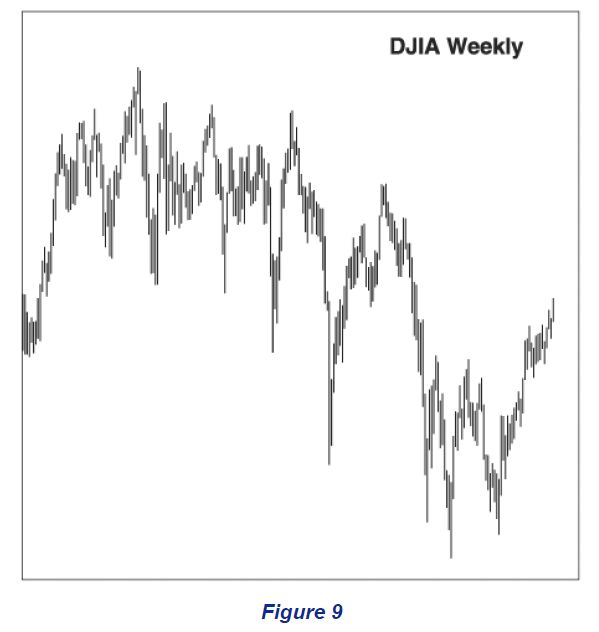
Figure 9 shows the DJIA around that time. Study it carefully. Can you find an anomaly on the graph? Is there an obvious time when the shocking events of "9/11" show up? If markets reacted to "exogenous shocks," as billiard balls do, there would be something obviously different on the graph at that time, wouldn't there? But there isn't.
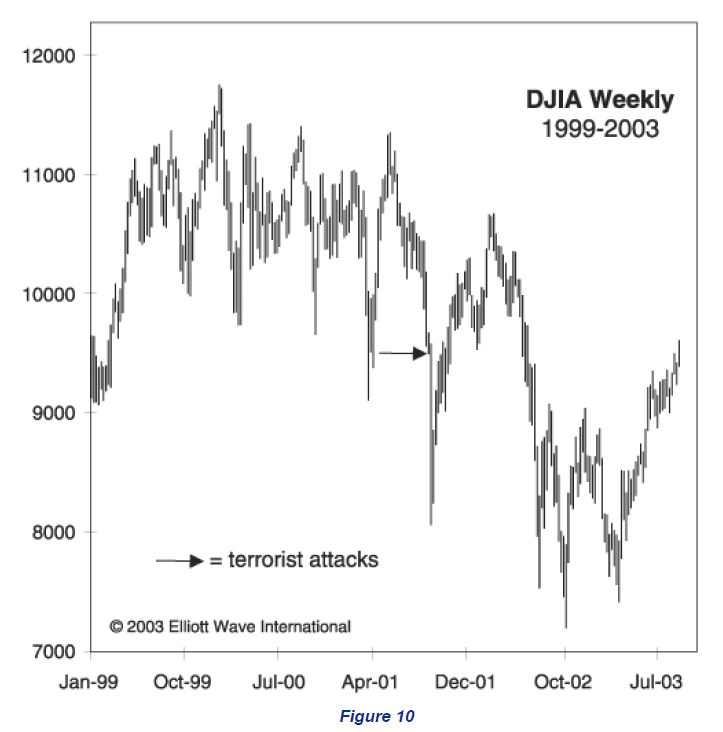
Figure 10 shows the timing of the 9/11 terrorist attacks. You may recall that authorities closed the stock market for four trading days plus a weekend. Question: Was it a certainty that the market would re-open on the downside? No! Some popular radio talk-show hosts and administration officials advocated buying stocks on the opening just to "show 'em." You sit with your massive short position, and you are nervous. But you are also lucky. The market opens down, continuing a decline that had already been in force for 17 weeks. You cheer. You're making money now! Well, you do for six days, anyway. Then the market leaps higher, and somewhere between one week and six months later you finally cover your shorts at a loss, disgusted and confused. If you are an everyday thoughtful person, you decide that events are irrelevant to markets and begin the long process of educating yourself on why markets move as they do. If you are a conventional economist, you don't bother.
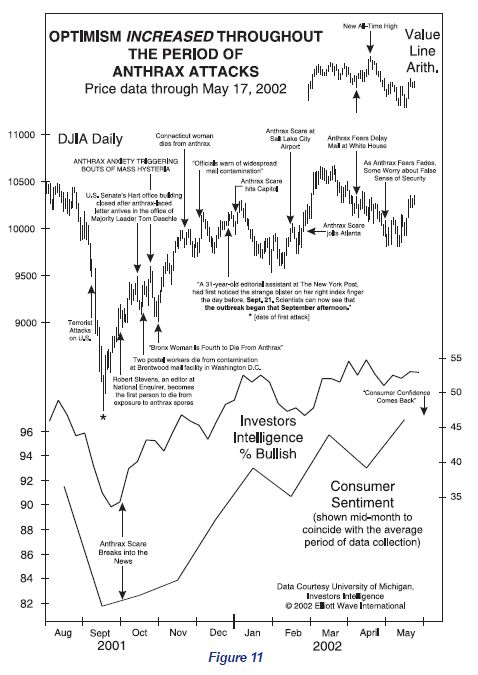
In case you still think that terrorism is a factor somewhere in the falling markets of 2000-2002, please read "Challenging the Conventional Assumption About the Presumed Sociological Effect of Terrorist News," which is reprinted in Pioneering Studies in Socionomics. It shows unequivocally that the terrorist events and related fears of that time encompassed a period when the market mostly went up and consumer sentiment improved. The graph that accompanies that study is reproduced here as Figure 11.
Now think about this: In real life, you don't get to know about dramatic events in advance. Investors who sold stocks upon hearing of the various events cited above did so because they believed that events cause changes in stock values. They all sold the low. I chose bad news for these exercises because it tends to be more dramatic, but the same irrelevance attaches to good news.
Since knowing dramatic events in advance would produce no value for investing, guessing events is an utter waste of time. There are no "inefficiencies" related to external causality that one may exploit.
If news is irrelevant to markets, how can the media explain almost every day's market action by the news? Answer: There is a lot of news every day. Commentators don't write their cause-and-effect stories before the session starts but after it ends. It's no trick to fit news to the market after it's closed. I am writing this paragraph the day after stocks had a big down day. The news at 8:30 a.m. yesterday was good, a "stronger-than-expected 1.8 percent jump in March retail sales." How, then, did this morning's newspaper, relying on cause and effect, explain yesterday's big drop? (Remember, it's easy to play games with cause and effect under the physics paradigm.) Here is the headline: "Rising-Rates Scenario Sends Stocks Reeling."2 This and other articles present the following ex-post-facto consensus reasoning: Investors appear to have decided that the good news that the economy is "starting to accelerate" might mean higher interest rates, which would be bearish if it happened. This contrived conclusion is doubly bizarre given the century-long history of interest-rate data, which (as the next section will show) belies such a belief. How, moreover, does one explain the fact that the stock market opened higher yesterday, in concert with the standard view of such news being "good"? There was no more big news that day. Had there been some "bad" news immediately after the opening, such inventive reasoning would not have been required. The "reason" for the rout would have been obvious, just as it was on the previous down day of this size, on which terrorists conveniently bombed trains in Spain. (Let me guess. You think that this example of news causality makes sense, don't you? Sorry. Did I mention that the U.S. stock market -- fully apprised of the news -- rallied until noon that day before selling off?)
|
Learn to Think Independently -- Download Your Free Independent Investor eBook "The Stock Market is Not Physics" is just one report in the more than 100 page, two-volume Independent Investor eBook. You'll get some of the most groundbreaking and eye-opening reports ever published in Elliott Wave International's 30-year history; you'll also get new analysis, forecasts and commentary to help you think independently in today's tumultuous market. |

This article was syndicated by Elliott Wave International and was originally published under the headline Stock Market Is Not Physics Part III. EWI is the world's largest market forecasting firm. Its staff of full-time analysts led by Chartered Market Technician Robert Prechter provides 24-hour-a-day market analysis to institutional and private investors around the world.
About the Publisher, Elliott Wave International Founded in 1979 by Robert R. Prechter Jr., Elliott Wave International (EWI) is the world's largest market forecasting firm. Its staff of full-time analysts provides 24-hour-a-day market analysis to institutional and private around the world.
© 2005-2022 http://www.MarketOracle.co.uk - The Market Oracle is a FREE Daily Financial Markets Analysis & Forecasting online publication.