Case for Sustained $100 Crude Oil
Commodities / Crude Oil Jan 04, 2012 - 02:12 AM GMTBy: Frank_Holmes
 In 2011, oil was one of the top performing commodities among those we track, with Brent rising more than 13 percent. Geopolitical risk and unexpected non-OPEC supply losses caused oil to rise significantly in early 2011. By October, we saw the black gold sink to a low of $96 per barrel before rising to its current level of nearly $108 a barrel.
Last year’s unrest demonstrated how major oil-producing regions can significantly affect oil prices. As I’ve previously stated, according to PIRA, the Middle East accounts for over 70 percent of OPEC oil production and, along with North Africa, more than 95 percent of the cartel’s capacity growth.
A disruption of the supply chain can also influence oil prices. One of the largest chokepoints along the global oil supply chain is the Strait of Hormuz, which roughly 90 percent of all Persian Gulf oil tankers—some 18 million barrels per day—pass through, according to Barclays. With Iran controlling the entire northern border of the strait, there is a significant chance for disruptions should the country fall into conflict or war.
The story will likely continue into the new year, as “sanctions against Iran, including a possible European Union oil embargo, and fear of an Israeli attack on Iran’s nuclear facilities led 2011 to close on a bullish note” for oil, said PIRA Energy Group in their new report today. Additionally, there’s new political uncertainty in Iraq that may keep oil elevated.
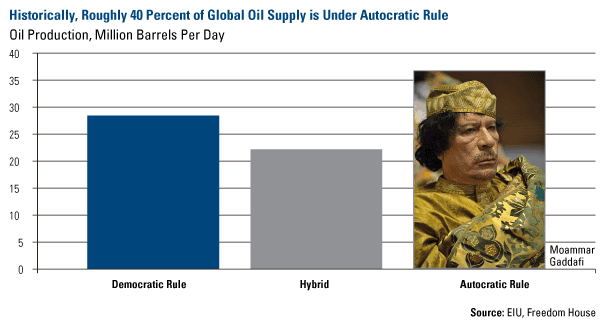
The chart below sums it up: With more than 40 percent of the world’s oil controlled under autocratic rule, oil supply in democratic nations likely depends on the state of autocratic nations.

Read The Many Factors Fueling a Return to $100 Oil
China Rises to Top of Energy Pyramid
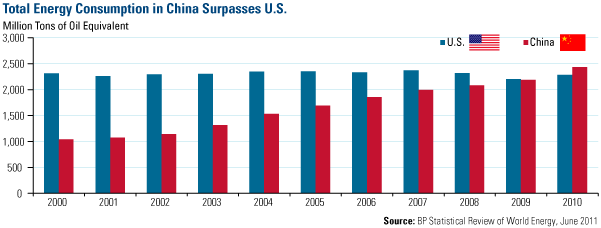
Another significant development in 2011 was that China surpassed the U.S. to become the world’s largest energy consumer. BP’s Statistical Review of World Energy report calculated that China’s energy consumption rate grew 11 percent over the previous year, with the country consuming 20 percent of global energy.

Read China is World’s Largest Energy Consumer
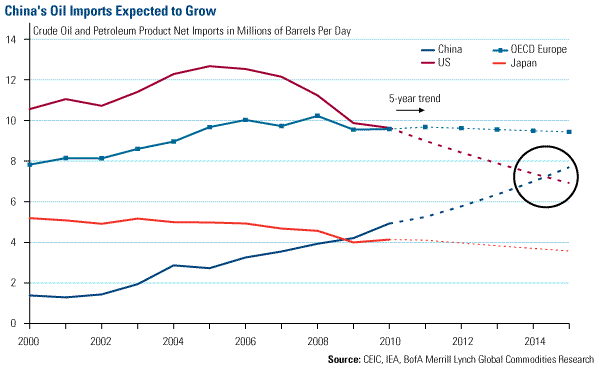
While coal accounts for a significant portion of China’s total energy use, the country’s need for oil should continue to rise. Its rising income levels, the government’s social housing plan, and an aggressive transportation effort to link 700 million people across more than 250 cities should continue drive this growth. Bank of America-Merrill Lynch agrees, suggesting that “China’s oil dependency will rise as U.S. imports fall.” In the chart below, it’s projected that China’s imports of crude oil and petroleum products will surpass the U.S. in 2014. BofA-ML thinks that on a volume basis, China oil imports “will grow quite rapidly on the back of rapid per capita income growth.”

China’s demand is what makes today’s oil situation different from the end of 2007. At that time, a lack of supply increased oil prices even though the U.S. was in a recession. What’s different is that “China is likely to re-accelerate” in 2012, according to Goldman Sachs.
China, along with other emerging markets, and the European Central Bank are in the early stages of a global easing cycle, primarily by cutting interest rates to spur growth. Also, the Federal Reserve should remain stimulative. These government actions set the stage for sustained, or perhaps higher, demand for oil. As stated earlier, geopolitical threats remain on the horizon, and could also be a positive catalyst for oil.
As always, our team will closely follow these events, as well as the monetary and fiscal policies, to find global investment opportunities in 2012.
We wish you and your family a very happy and prosperous new year!
John Derrick contributed to this commentary.
U.S. Global Investors, Inc. is an investment management firm specializing in gold, natural resources, emerging markets and global infrastructure opportunities around the world. The company, headquartered in San Antonio, Texas, manages 13 no-load mutual funds in the U.S. Global Investors fund family, as well as funds for international clients.
For more updates on global investing from Frank and the rest of the U.S. Global Investors team, follow us on Twitter at www.twitter.com/USFunds or like us on Facebook at www.facebook.com/USFunds. You can also watch exclusive videos on what our research overseas has turned up on our YouTube channel at www.youtube.com/USFunds.
By Frank Holmes
CEO and Chief Investment Officer
U.S. Global Investors
U.S. Global Investors, Inc. is an investment management firm specializing in gold, natural resources, emerging markets and global infrastructure opportunities around the world. The company, headquartered in San Antonio, Texas, manages 13 no-load mutual funds in the U.S. Global Investors fund family, as well as funds for international clients.
All opinions expressed and data provided are subject to change without notice. Some of these opinions may not be appropriate to every investor.
Standard deviation is a measure of the dispersion of a set of data from its mean. The more spread apart the data, the higher the deviation. Standard deviation is also known as historical volatility. All opinions expressed and data provided are subject to change without notice. Some of these opinions may not be appropriate to every investor. The S&P 500 Stock Index is a widely recognized capitalization-weighted index of 500 common stock prices in U.S. companies. The NYSE Arca Gold BUGS (Basket of Unhedged Gold Stocks) Index (HUI) is a modified equal dollar weighted index of companies involved in gold mining. The HUI Index was designed to provide significant exposure to near term movements in gold prices by including companies that do not hedge their gold production beyond 1.5 years. The MSCI Emerging Markets Index is a free float-adjusted market capitalization index that is designed to measure equity market performance in the global emerging markets. The U.S. Trade Weighted Dollar Index provides a general indication of the international value of the U.S. dollar.
Frank Holmes Archive |
© 2005-2022 http://www.MarketOracle.co.uk - The Market Oracle is a FREE Daily Financial Markets Analysis & Forecasting online publication.


