


Silver Head and Shoulders Top Suggesting Price Crash
Commodities / Gold and Silver 2012 Jan 08, 2012 - 01:36 PM GMTBy: Clive_Maund

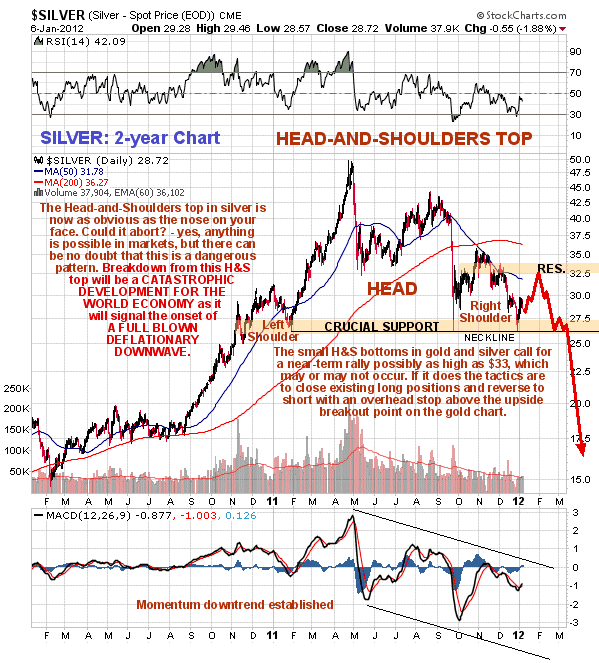
 A large and very bearish looking Head-and-Shoulders top appears to be completing in silver which portends a severe decline and thus a deflationary downwave. However, a factor complicating the picture in recent weeks has been the COT structure for silver and sentiment indicators, both of which look very bullish. For reasons that are set out in the parallel Gold Market update, the COT is believed to be highly deceptive at this time, and with regards to sentiment indicators, there is the scope for readings to get even worse (even more bullish) in the event of a breakdown and severe decline.
The big Head-and-Shoulders top can be clearly seen on the 2-year chart for silver. What is remarkable about this pattern is that its "neckline" or lower support line is perfectly horizontal with the price bouncing back up late in December EXACTLY from its September intraday low. This large top area appears to be complete, although action over the past couple of weeks suggests that we will see one last rally before it turns down and breaks below the support at the bottom of the pattern. It is rather hard to determine what it would take to abort its bearish implications - a break above the Right Shoulder high at about $35.70 would be a bullish development but not convincing - it is better for us to use a gold breakout above the top line of its Descending Triangle as a guide to a probable abort of the bearish patterns in both gold and silver.
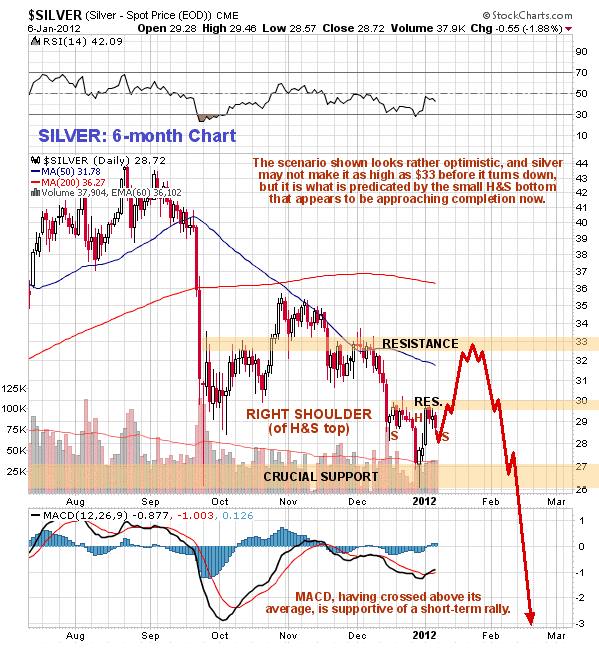
Although the longer-term charts for silver look rough, on the shorter-term 6-month chart we can see that recent action suggests that a near-term rally of sorts is likely. A small Head-and-Shoulders bottom appears to have formed above recent lows that suggests an advance perhaps as far as $33 before the price turns lower again. A possible scenario is shown on the chart. We went long shortly after the low was put in as a low risk trade with a stop beaneath the crucial support level at and above the September lows, and we will probably take modest profits on an approach to $33 should silver get that high in the near future, and depending how gold looks at the time, reverse to short.
By Clive Maund
CliveMaund.com
For billing & subscription questions: subscriptions@clivemaund.com
© 2012 Clive Maund - The above represents the opinion and analysis of Mr. Maund, based on data available to him, at the time of writing. Mr. Maunds opinions are his own, and are not a recommendation or an offer to buy or sell securities. No responsibility can be accepted for losses that may result as a consequence of trading on the basis of this analysis.
Mr. Maund is an independent analyst who receives no compensation of any kind from any groups, individuals or corporations mentioned in his reports. As trading and investing in any financial markets may involve serious risk of loss, Mr. Maund recommends that you consult with a qualified investment advisor, one licensed by appropriate regulatory agencies in your legal jurisdiction and do your own due diligence and research when making any kind of a transaction with financial ramifications.
Clive Maund Archive |
© 2005-2022 http://www.MarketOracle.co.uk - The Market Oracle is a FREE Daily Financial Markets Analysis & Forecasting online publication.