New Technical Indicator that Times Bull Market Peaks in Gold and Silver
InvestorEducation / Forecasts & Technical Analysis Feb 08, 2007 - 01:44 AM GMTBy: Roland_Watson
There is one question above all others that is on the minds of gold and silver investors. It can be expressed in two ways.
The first is "At what price will the gold and silver bull market end?"
The second is similar "At what date will the gold and silver bull market end?"
The chief end of both questions is the same, getting out with maximum profits for the holder of gold and silver be it in bullion, ETF or mining stock form.
The subject of this article is a new technical indicator that can help answer both questions - first for silver and second for gold. It does not give you the answer 1, 2 or 10 years in advance but it rather flags a sell when one important condition is fulfilled.
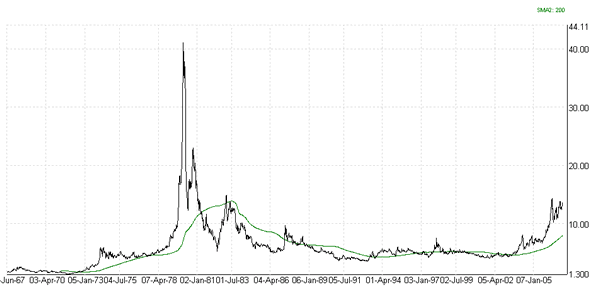
Take a look at the two charts below. The first is the rise and fall of the price of silver over the last forty years. No doubt many readers are familiar with the iconic 1980 spike that cuts the graph in two.


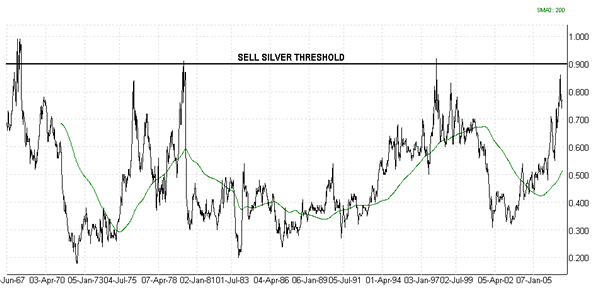
The second graph shows the corresponding leverage that silver achieved over gold over a rolling four-year basis. I have addressed the subject of the gold-silver leverage ratio in previous articles. The graph has been recalibrated to run from 0 to 1. Note that this chart peaks on three major occasions in the last 40 years.
The first of those peaks is near the top of the 1968 "Johnson" spike when silver doubled in price after the USA government went off silver coinage.
The second is near the well-known 1980 "Hunt" spike.
The third is near the 1998 "Buffett" spike when Warren Buffett purchased nearly 130 million ounces of silver.
Each time that the four-year leverage breached our sell threshold, that particular bull market was over for a number of years. No matter how high the price was or how long it took to get there, the leverage number peaked in the 0.9 to 1.0 range. Our thesis is therefore simple; sell silver and gold when this rare threshold is entered.
What is the reasoning behind this powerful new indicator? There are four pillars to this theory:
1. In a precious metals bull market, silver will tend to outperform gold.
2. However, there is a known limit to which this silver out performance can go.
3. This limit is hit at the top of major silver bull markets (i.e. 0.9 to 1.0).
4. The reaching of this silver limit tends to also be the end of the corresponding gold bull market.
Back testing this indicator, you would have got out 3% below the top price of the 1968 peak, 12% below the 1980 peak and 6% below the 1998 peak. Using price per ounce numbers, this indicator flagged a sell five days after the 1980 silver bull peaked for a closing exit price of $37 as opposed to the closing $42 on the 21st January 1980. Sad to say, the majority failed to get out at such a high point.
 |
Based on 40 years of historical data, The Silver Analyst newsletter believes it has discovered and invented an indicator that should form a part of each investor's core decision armory.
We call it the SLI or Silver Leverage Indicator and it is tracked on a regular basis only in the Silver Analyst newsletter.
By Roland Watson
http://silveranalyst.blogspot.com
This article is adapted from issue one of The Silver Analyst newsletter.Further analysis and comment on the silver market can be read in the subscriber-only Silver Analyst newsletter described at http://silveranalyst.blogspot.com where readers can obtain the first issue free. Comments and questions are also invited via email to silveranalysis@yahoo.co.uk
© 2005-2022 http://www.MarketOracle.co.uk - The Market Oracle is a FREE Daily Financial Markets Analysis & Forecasting online publication.


