


When Gold New All Time High?
Commodities / Gold and Silver 2012 Jan 18, 2012 - 03:14 PM GMTBy: Jeff_Clark

 By Jeff Clark, Casey Research : Some investors are frustrated and a few are worried that gold seems stuck in a rut. This stall in price has happened before, of course, but since 2001 it's always eventually powered to a new high. Unless one thinks the gold bull market is over, it's natural to wonder how long might we have to wait before seeing another new high.
Absent some sort of global shock that sparks another rush into gold (easily possible in today's climate), I think the answer may lie in examining the size and length of past corrections and how long it took gold to reach new highs afterward.
It makes sense that big corrections would take longer to reach new highs than small ones, but I wanted to confirm that assumption with the data. I also wanted to determine if there were any patterns in past recoveries that would give us some clues that we can apply to today.
Gold set a record on September 5 at $1,895 an ounce (London PM Fix) and to date has fallen as low as $1,531 (December 29), a decline of 19.2%. In order to determine how long it might take to breach $1,895 again, I measured how long it took new highs to be mounted after big corrections in the past.
The following chart details three large corrections since 2001, and calculates how many weeks it took the gold price to a) breach the old high, and b) stay above that level.
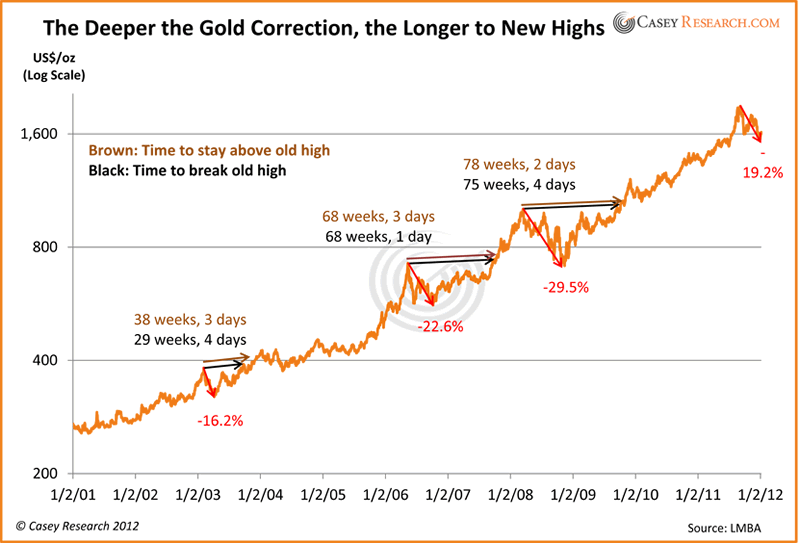
As you can see, it took a significant amount of time for gold to forge new highs after big selloffs. And yes, the bigger the correction, the longer it took.
In 2006, after a total fall of 22.6%, it took a year and four months for gold to surpass its old high. After the 2008 meltdown, it was a year and six months later before gold hit a new record.
Our recent correction more closely resembles the one in 2003. After a 16.2% drop, gold matched the old high seven months later. It took another two months to stay above it.
So when do we reach a new high in the gold price?
Let's apply the same ratio from the 2003 correction and recovery: If it took 29 weeks and four days to reach a new high after a 16.2% correction, a 19.2% pullback would take 35 weeks and 0 days. That works out to Monday, May 7, 2012.
An exact date is pure conjecture, of course. On one hand, gold could drop below the $1,531 low if the need for cash and liquidity forces large investors to resume selling. On the other hand, Europe and/or the US could resume money printing on a large scale and send gold soaring overnight. The point of the data is that it signals we shouldn't be too surprised if we don't hit $1,900 for another four months yet. And if it takes another two months or so to stay above it.
Think that's too long? There are some important reasons to not let it discourage you…
Once gold breaches its old high, you'll probably never be able to buy it at current prices again.
That's a rather obvious statement, but let it sink in. Buying now at $1,600 and then watching the price fall to, say, $1,500, wouldn't be fun – but it'll probably hit $2,000 or higher before the year's over, never to visit the $1,600s again this cycle. If that turns out to be correct, the next four months will be the very last time you can buy at these levels. You'll have to pay a higher price from then on.
Look at it this way: If the "rebound ratio" is similar to the one in 2003, you have four months and counting to buy whatever gold you want before it's no longer on sale. It's entirely possible that by this time next year you will never again be able to buy gold for less than $2,000 an ounce – unless maybe it's in "new dollars" or some other currency that circulates with fewer zeros on the notes.
The data can also help you ignore the noise about gold's bull market being over and other nonsense spewed from mainstream media types. If gold doesn't hit $1,900 until May, you'll know this is simply normal price behavior and that they're overlooking basic patterns in the data. And when September rolls around – seasonally the strongest month of the year for gold – and the price is climbing relentlessly and they're caught off guard by it, you'll already be positioned.
Regardless of the date, we're confident that a new high in the gold price will come at some point, because many major currencies are unsound and overburdened with debt – and they're all fiat and subject to government tinkering and mismanagement. Indeed, the ultimate high could be frighteningly higher than current levels. As such, we suggest taking advantage of prices that won't be available indefinitely.
After all, you don't want to be left without enough of nature's cure for man's monetary ills.
[Traditional savings accounts simply do not cut it in today's economic environment – government-promoted robbery means they often lose money overall. Learn how you can protect your assets –and even get ahead.]
© 2012 Copyright Casey Research - All Rights Reserved
Disclaimer: The above is a matter of opinion provided for general information purposes only and is not intended as investment advice. Information and analysis above are derived from sources and utilising methods believed to be reliable, but we cannot accept responsibility for any losses you may incur as a result of this analysis. Individuals should consult with their personal financial advisors.
© 2005-2022 http://www.MarketOracle.co.uk - The Market Oracle is a FREE Daily Financial Markets Analysis & Forecasting online publication.