


How to Work Out of the Long and Painful Debt Deleveraging Process
Interest-Rates / Global Debt Crisis 2012 Jan 24, 2012 - 07:43 AM GMTBy: John_Mauldin

 This week we look at a report called “Working Out of Debt,” about debt and deleveraging, from the McKinsey Global Institute. This is a well-done summary of their longer paper, which has been updated, called “Debt and deleveraging: Uneven progress on the path to growth.” I discussed the original paper both in my regular letter and in Endgame. It is one of the best, most definitive pieces on the topic I have read. For those trying to understand how the deleveraging process will affect their particular world, I think it is a must-read. I have been spending more and more time thinking about the whole process of deleveraging, and am coming to think deleveraging is the critical and fundamental factor shaping the economic environment and impacting every decision countries and businesses are faced with. This paper was done by Karen Croxson, Susan Lund, and Charles Roxburgh; and they are to be especially commended for their insight and work.
This summary and the full report look at the relevant lessons from history about how governments can support economic recovery amid deleveraging, and at the signposts business leaders can look for to see where economies are in that process.
Overall, they tell us, the deleveraging process has only just begun: “During the past two and a half years, the ratio of debt to GDP, driven by rising government debt, has actually grown in the aggregate in the world’s ten largest developed economies. Private-sector debt has fallen, however, which is in line with historical experience: overextended households and corporations typically lead the deleveraging process; governments begin to reduce their debts later, once they have supported the economy into recovery.”
You can sign up at their website and see the full report at https://www.mckinseyquarterly.com/Working_out_of_debt_2914. I would strongly recommend you do so, not only for this report but because their website is chock full of well-done articles on a wide variety of topics, and they update it frequently with more material. It is all top-notch. It is worth visiting just to see what they have done in areas that may be of more specific interest to you, or because like me you are an information junkie and want to keep up on a wider world than just macro-economics.
Have a great week. Mine will be busy but interesting, which is always good. And this Friday I start a series on the choices that we face in the US, so there will be lots to ponder amidst the noise.
Your wondering how the Giants got into the Super Bowl analyst,
John Mauldin, Editor
Outside the Box
JohnMauldin@2000wave.com
Working Out of Debt
McKinsey Global Institute
January 2012
Karen Croxson, Susan Lund, and Charles Roxburgh
An update of our research on the efforts of developed countries to work out from under a massive overhang of debt shows how uneven progress has been. US households have made the greatest gains so far.
The problem
The deleveraging process that began in 2008 is proving to be long and painful, with many countries struggling to reduce debt during a sluggish economic recovery.
Why it matters
National economic prospects depend on how deleveraging plays out. Historical experience suggests that excessive debt is a drag on growth and that GDP rebounds in the later years of deleveraging.
What to do about it
Companies active in countries that are experiencing deleveraging should closely monitor progress toward targets that historically have coincided with economic improvment. These include banking-system stabilization, structural reforms, growing exports and private investments, and housing-market stabilization.
The deleveraging process that began in 2008 is proving to be long and painful. Historical experience, particularly post–World War II debt reduction episodes, which the McKinsey Global Institute reviewed in a report two years ago, suggested this would be the case. And the eurozone’s debt crisis is just the latest demonstration of how toxic the consequences can be when countries have too much debt and too little growth. (The full report, Debt and deleveraging: The global credit bubble and its economic consequences (January 2010), is available online at mckinsey.com/mgi.)
We recently took another look forward and back—at the relevant lessons from history about how governments can support economic recovery amid deleveraging and at the signposts business leaders can watch to see where economies are in that process. We reviewed the experience of the United States, the United Kingdom, and Spain in depth, but the signals should be relevant for any country that’s deleveraging.
Overall, the deleveraging process has only just begun. During the past two and a half years, the ratio of debt to GDP, driven by rising government debt, has actually grown in the aggregate in the world’s ten largest developed economies. Private-sector debt has fallen, however, which is in line with historical experience: overextended households and corporations typically lead the deleveraging process; governments begin to reduce their debts later, once they have supported the economy into recovery.
Different countries, different paths
In the United States, the United Kingdom, and Spain, all of which experienced significant credit bubbles before the financial crisis of 2008, households have been reducing their debt at different speeds. The most significant reduction occurred among US households. Let’s review each country in turn.
The United States: Light at the end of the tunnel
Household debt outstanding has fallen by $584 billion (4 percent) from the end of 2008 through the second quarter of 2011 in the United States. Defaults account for about 70 and 80 percent of the decrease in mortgage debt and consumer credit, respectively. A majority of the defaults reflect financial distress: overextended homeowners who lost jobs during the recession or faced medical emergencies found that they could not afford to keep up with debt payments. It is estimated that up to 35 percent of the defaults resulted from strategic decisions by households to walk away from their homes, since they owed far more than their properties were worth. This option is more available in the United States than in other countries, because in 11 of the 50 states—including hard-hit Arizona and California—mortgages are nonrecourse loans, so lenders cannot pursue the other assets or income of borrowers who default. Even in recourse states, US banks historically have rarely pursued borrowers.
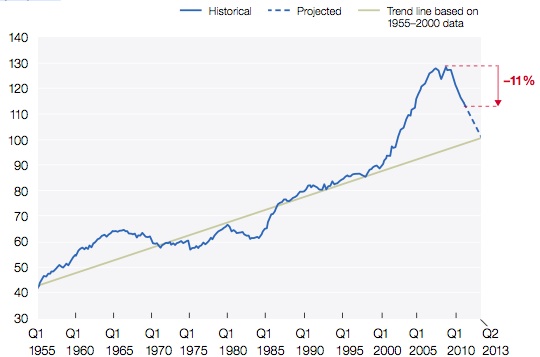
Historical precedent suggests that US households could be up to halfway through the deleveraging process, with one to two years of further debt reduction ahead. We base this estimate partly on the long-term trend line for the ratio of household debt to disposable income. Americans have constantly increased their debt levels over the past 60 years, reflecting the development of mortgage markets, consumer credit, student loans, and other forms of credit. But after 2000, the ratio of household debt to income soared, exceeding the trend line by about 30 percentage points at the peak (Exhibit 1). As of the second quarter of 2011, this ratio had fallen by 11 percent from the peak; at the current rate of deleveraging, it would return to trend by mid-2013. Faster grow th of disposable income would, of course, speed this process.
Exhibit 1
Although the debt ratio of US households remains high, they may be halfway through the deleveraging process.
US household debt as % of gross disposable income, quarterly, seasonally adjusted
We came to a similar conclusion when we compared the experiences of US households with those of households in Sweden and Finland in the 1990s. During that decade, these Nordic countries endured similar banking crises, recessions, and deleveraging. In both, the ratio of household debt to income declined by roughly 30 percent from its peak. As Exhibit 2 indicates, the United States is closely tracking the Swedish experience, and the picture looks even better considering that clearing the backlog of mortgages already in the foreclosure pipeline could reduce US household debt ratios by an additional six percentage points.
As for the debt service ratio of US households, it’s now down to 11.5 percent—well below the peak of 14.0 percent, in the third quarter of 2007, and lower than it was even at the start of the bubble, in 2000. Given current low interest rates, this metric may overstate the sustainability of current US household debt levels, but it provides another indication that they are moving in the right direction.
Exhibit 2
In the United States, household deleveraging may have only a few more years to go, while in Spain and the United Kingdom it has just begun.
Household debt,% of gross annual disposable income1
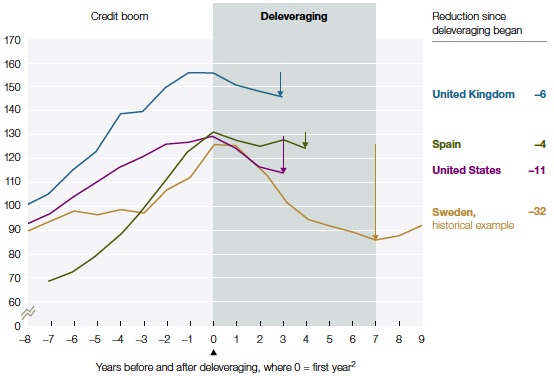
1 Total household debt outstanding and annual disposable income for Spain, United Kingdom, and United States as of Q4 in given year.
2 For Sweden, 1998; Spain, 2007; United Kingdom and United States, 2008. Source: Statistics Sweden, Haver Analytics; McKinsey Global Institute analysis
Nonetheless, after US consumers finish deleveraging, they probably won’t be as powerful an engine of global growth as they were before the crisis. That’s because home equity loans and cash-out refinancing, which from 2003 to 2007 let US consumers extract $2.2 trillion of equity from their homes—an amount more than twice the size of the US fiscal-stimulus package—will not be available. The refinancing era is over: housing prices have declined, the equity in residential real estate has fallen severely, and lending standards are tighter. Excluding the impact of home equity extraction, real consumption growth in the pre-crisis years would have been around 2 percent per annum—similar to the annualized rate in the third quarter of 2011.
The United Kingdom: Debt has only just begun to fall
Three years after the start of the financial crisis, UK households have deleveraged only slightly, with the ratio of debt to disposable income falling from 156 percent in the fourth quarter of 2008 to 146 percent in second quarter of 2011. This ratio remains significantly higher than that of US households at the bubble’s peak. Moreover, the outstanding stock of household debt has fallen by less than 1 percent. Residential mortgages have continued to grow in the United Kingdom, albeit at a much slower pace than they did before 2008, and this has offset some of the £25 billion decline in consumer credit.
Still, many UK residential mortgages may be in trouble. The Bank of England estimates that up to 12 percent of them may be in some kind of forbearance process, and an additional 2 percent are delinquent—similar to the 14 percent of US mortgages that are in arrears, have been restructured, or are now in the foreclosure pipeline (Exhibit 3). This process of quiet forbearance in the United Kingdom, combined with record-low interest rates, may be masking significant dangers ahead. Some 23 percent of UK households report that they are already “somewhat” or “heavily” burdened in paying off unsecured debt.2 Indeed, the debt payments of UK households are one-third higher than those of their US counterparts—and 10 percent higher than they were in 2000, before the bubble. This statistic is particularly problematic because at least two-thirds of UK mortgages have variable interest rates, which expose borrowers to the potential for soaring debt payments should interest rates rise.
Given the minimal amount of deleveraging among UK households, they do not appear to be following Sweden or Finland on the path of significant, rapid deleveraging. Extrapolating the recent pace of UK household deleveraging, we find that the ratio of household debt to disposable income would not return to its long-term trend until 2020. Alternatively, it’s possible that developments in UK home prices, interest rates, and GDP growth will cause households to reduce debt slowly over the next several years, to levels that are more sustainable but still higher than historic trends. Overall, the United Kingdom needs to steer a difficult course that reduces household debt steadily, but at a pace that doesn’t stifle growth in consumption, which remains the critical driver of UK GDP.
Spain: The long unwinding road
Since the credit crisis first broke, Spain’s ratio of household debt to disposable income has fallen by 4 percent and the outstanding stock of household debt by just 1 percent. As in the United Kingdom, home mortgages and other forms of credit have continued to grow while consumer credit has fallen sharply.
Spain’s mortgage default rate climbed following the crisis but remains relatively low, at approximately 2.5 percent, thanks to low interest rates. The number of mortgages in forbearance has also risen since the crisis broke, however. And more trouble may lie ahead. Almost half of the households in the lowest-income quintile face debt payments representing more than 40 percent of their income, compared with slightly less than 20 percent for low-income US households. Meanwhile, the unemployment rate in Spain is now 21.5 percent, up from 9 percent in 2006. For now, households continue to make payments to avoid the country’s conservative recourse laws, which allow lenders to go after borrowers’ assets and income for a long period.
In Spain, unlike most other developed economies, the corporate sector’s debt levels have risen sharply over the past decade. A significant drop in interest rates after the country joined the eurozone, in 1999, unleashed a run-up in real-estate spending and an enormous expansion in corporate debt. Today, Spanish corporations hold twice as much debt relative to national output as do US companies, and six times as much as German companies. Debt reduction in the corporate sector may weigh on growth in the years to come.
Exhibit 3
If forbearance is factored in, up to 14 percent of UK mortgages could be in difficulty—identical to the percentage of US mortgages in difficulty today.
% of residential mortgages in difficulty, 2011
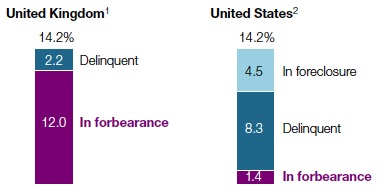
1 UK delinquency data as of Q2 2011, represents mortgage loans >1.5% in arrears. UK forebearance data based on worst-case estimates from Bank of England Financial Stability Report, June 2011.
2 US delinquency and foreclosure data as of Q1 2011; delinquency represents mortgage loans >30 days delinquent.
Source: Mortgage Bankers Association, United States; Bank of England; McKinsey Global Institute analysis
Signposts for recovery
Paring debt and laying a foundation for sustainable long-term growth should take place simultaneously, difficult as that may seem. For economies facing this dual challenge today, a review of history offers key lessons. Three historical episodes of deleveraging are particularly relevant: those of Finland and Sweden in the 1990s and of South Korea after the 1997 financial crisis. All these countries followed a similar path: bank deregulation (or lax regulation) led to a credit boom, which in turn fueled real-estate and other asset bubbles. When they collapsed, these economies fell into deep recession, and debt levels fell.
In all three countries, growth was essential for completing a fiveto seven-year-long deleveraging process. Although the private sector may start to reduce debt even as GDP contracts, significant public-sector deleveraging, absent a sovereign default, typically occurs only when GDP growth rebounds, in the later years of deleveraging (Exhibit 4). That’s true because the primary factor causing public deficits to rise after a banking crisis is declining tax revenue, followed by an increase in automatic stabilizer payments, such as unemployment benefits. (See Fiscal Monitor: Navigating the Fiscal Challenges Ahead, International Monetary Fund, May 2010.)
Exhibit 4
Significant public-sector deleveraging typically occurs after GDP growth rebounds.
Average of relevant historical deleveraging episodes (Sweden and Finland in 1990s)
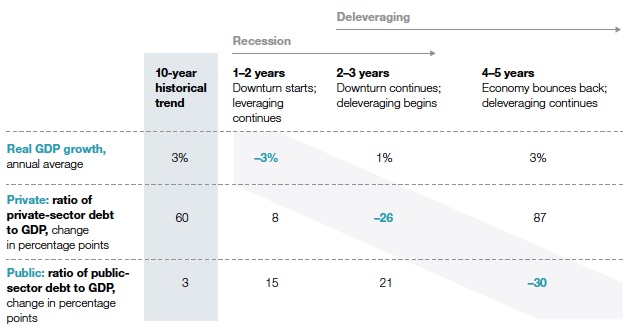
Source: Haver Analytics; International Monetary Fund (IMF); McKinsey Global Institute analysis
A rebound of economic growth in most deleveraging episodes allows countries to grow out of their debts, as the rate of GDP growth exceeds the rate of credit growth.
No two deleveraging economies are the same, of course. As relatively small economies deleveraging in times of strong global economic expansion, Finland, South Korea, and Sweden could rely on exports to make a substantial contribution to growth. Today’s deleveraging economies are larger and face more difficult circumstances. Still, historical experience suggests five questions that business and government leaders should consider as they evaluate where today’s deleveraging economies are heading and what policy priorities to emphasize.
1. Is the banking system stable?
In Finland and Sweden, banks were recapitalized and some were nationalized. In South Korea, some banks were merged and some were shuttered, and foreign investors for the first time got the right to become majority investors in financial institutions. The decisive resolution of bad loans was critical to kick-start lending in the economicrebound phase of deleveraging.
The financial sectors in today’s deleveraging economies began to deleverage significantly in 2009, and US banks have accomplished the most in that effort. Even so, banks will generally need to raise significant amounts of additional capital in the years ahead to comply with Basel III and national regulations. In most European countries, business demand for credit has fallen amid slow growth. The supply of credit, to date, has not been severely constrained. A continuation of the eurozone crisis, however, poses a risk of a significant credit contraction in 2012 if banks are forced to reduce lending in the face of funding constraints. Such a forced deleveraging would significantly damage the region’s ability to escape recession.
2. Are structural reforms in place?
In the 1990s, each of the crisis countries embarked on a program of structural reform. For Finland and Sweden, accession to the European Union led to greater economies of scale and higher direct investment. Deregulation in specific industry sectors—for example, retailing—also played an important role. (See Kalle Bengtsson, Claes Ekström, and Diana Farrell, “Sweden’s growth paradox,” mckinseyquarterly.com, June 2006; and Sweden’s Economic Performance: Recent Developments, Current Priorities (May 2006), available online at mckinsey.com/mgi.) South Korea followed a remarkably similar course as it restructured its large corporate conglomerates, or chaebol, and opened its economy wider to foreign investment. These reforms unleashed growth by increasing competition within the economy and pushing companies to raise their productivity.
Today’s troubled economies need reforms tailored to the circumstances of each country. The United States, for instance, ought to streamline and accelerate regulatory approvals for business investment, particularly by foreign companies. The United Kingdom should revise its planning and zoning rules to enable the expansion of successful high-growth cities and to accelerate home building. Spain should drastically simplify business regulations to ease the formation of new companies, help improve productivity by promoting the creation of larger ones, and reform labor laws. (A Growth Agenda for Spain, McKinsey & Company and FEDEA, 2010.) Such structural changes are particularly important for Spain because the fiscal constraints now buffeting the European Union mean that the country cannot continue to boost its public debt to stimulate the economy. Moreover, as part of the eurozone, Spain does not have the option of currency depreciation to stimulate export growth.
3. Have exports surged?
In Sweden and Finland, exports grew by 10 and 9.4 percent a year, respectively, between 1994 and 1998, when growth rebounded in the later years of deleveraging. This boom was aided by strong exportoriented companies and the significant currency devaluations that occurred during the crisis (34 percent in Sweden from 1991 to 1993). South Korea’s 50 percent devaluation of the won, in 1997, helped the nation boost its share of exports in electronics and automobiles.
Even if exports alone cannot spur a broad recovery, they will be important contributors to economic growth in today’s deleveraging economies. In this fragile environment, policy makers must resist protectionism. Bilateral trade agreements, such as those recently passed by the United States, can help. Salvaging what we can from the Doha round of trade talks will be important. Service exports, including the “hidden” ones that foreign students and tourists generate, can be a key component of export growth in the United Kingdom and the United States.
4. Is private investment rising?
Another important factor that boosted growth in Finland, South Korea, and Sweden was the rapid expansion of investment. In Sweden, it rose by 9.7 percent annually during the economic rebound that began in 1994. Accession to the European Union was part of the impetus. Something similar happened in South Korea after 1998 as barriers to foreign direct investment fell. These soaring inflows helped offset slower private-consumption growth as households deleveraged.
Given the current very low interest rates in the United Kingdom and the United States, there is no better time to embark upon investments. Those for infrastructure represent an important enabler, and today there are ample opportunities to renew the aging energy and transportation networks in those countries. With public funding limited, the private sector can play an important role in providing equity capital, if pricing and regulatory structures enable companies to earn a fair return.
5. Has the housing market stabilized?
During the three historical episodes discussed here, the housing market stabilized and began to expand again as the economy rebounded. In the Nordic countries, equity markets also rebounded strongly at the start of the recovery. This development provided additional support for a sustainable rate of consumption growth by further increasing the “wealth effect” on household balance sheets.
In the United States, new housing starts remain at roughly one-third of their long-term average levels, and home prices have continued to decline in many parts of the country through 2011. Without price stabilization and an uptick in housing starts, a stronger recovery of GDP will be difficult, since residential real-estate construction alone contributed 4 to 5 percent of GDP in the United States before the housing bubble. (In 2010, residential real-estate investment accounted for just 2.3 percent of GDP, compared with 4.4 percent in 2000, before the housing-bubble years. Personal consumption on furniture and other household durables added about 2 percent to growth in 2000.) Housing also spurs consumer demand for durable goods such as appliances and furnishings and therefore boosts the sale and manufacture of these products.
At a time when the economic recovery is sputtering, the eurozone crisis threatens to accelerate, and trust in business and the financial sector is at a low point, it may be tempting for senior executives to hunker down and wait out macroeconomic conditions that seem beyond anyone’s control. That approach would be a mistake. Business leaders who understand the signposts, and support government leaders trying to establish the preconditions for growth, can make a difference to their own and the global economy.
The authors wish to thank Toos Daruvala and James Manyika for their thoughtful input, as well as Albert Bollard and Dennis Bron for their contributions to the research supporting this article.
Karen Croxson, a fellow of the McKinsey Global Institute (MGI), is based in McKinsey’s London office; Susan Lund is director of research at MGI and a principal in the Washington, DC, office; Charles Roxburgh is a director of MGI and a director in the London office.
___________________________
Deleveraging: Where are we now?
The financial crisis highlighted the danger of too much debt, a message that has only been reinforced by Europe’s recent sovereign-debt challenges. And new McKinsey Global Institute research shows that the unwinding of debt—or deleveraging—has barely begun. Since 2008, debt ratios have grown rapidly in France, Japan, and Spain and have edged downward only in Australia, South Korea, and the United States. Overall, the ratio of debt to GDP has grown in the world’s ten largest economies.

1 Defined as all credit-market borrowing, including loans and fixed-income securities. Some data have been revised since our Jan 2010 report.
2 Defined as an increase of 25 percentage points or higher. Source: Haver Analytics; national central banks; McKinsey Global Institute analysis
By John F. Mauldin
Outside the Box is a free weekly economic e-letter by best-selling author and renowned financial expert, John Mauldin. You can learn more and get your free subscription by visiting www.JohnMauldin.com.
Please write to johnmauldin@2000wave.com to inform us of any reproductions, including when and where copy will be reproduced. You must keep the letter intact, from introduction to disclaimers. If you would like to quote brief portions only, please reference www.JohnMauldin.com.
John Mauldin, Best-Selling author and recognized financial expert, is also editor of the free Thoughts From the Frontline that goes to over 1 million readers each week. For more information on John or his FREE weekly economic letter go to: http://www.frontlinethoughts.com/
To subscribe to John Mauldin's E-Letter please click here:http://www.frontlinethoughts.com/subscribe.asp
Copyright 2012 John Mauldin. All Rights Reserved
Note: John Mauldin is the President of Millennium Wave Advisors, LLC (MWA), which is an investment advisory firm registered with multiple states. John Mauldin is a registered representative of Millennium Wave Securities, LLC, (MWS), an FINRA registered broker-dealer. MWS is also a Commodity Pool Operator (CPO) and a Commodity Trading Advisor (CTA) registered with the CFTC, as well as an Introducing Broker (IB). Millennium Wave Investments is a dba of MWA LLC and MWS LLC. Millennium Wave Investments cooperates in the consulting on and marketing of private investment offerings with other independent firms such as Altegris Investments; Absolute Return Partners, LLP; Plexus Asset Management; Fynn Capital; and Nicola Wealth Management. Funds recommended by Mauldin may pay a portion of their fees to these independent firms, who will share 1/3 of those fees with MWS and thus with Mauldin. Any views expressed herein are provided for information purposes only and should not be construed in any way as an offer, an endorsement, or inducement to invest with any CTA, fund, or program mentioned here or elsewhere. Before seeking any advisor's services or making an investment in a fund, investors must read and examine thoroughly the respective disclosure document or offering memorandum. Since these firms and Mauldin receive fees from the funds they recommend/market, they only recommend/market products with which they have been able to negotiate fee arrangements.
Opinions expressed in these reports may change without prior notice. John Mauldin and/or the staffs at Millennium Wave Advisors, LLC and InvestorsInsight Publishing, Inc. ("InvestorsInsight") may or may not have investments in any funds cited above.
Disclaimer PAST RESULTS ARE NOT INDICATIVE OF FUTURE RESULTS. THERE IS RISK OF LOSS AS WELL AS THE OPPORTUNITY FOR GAIN WHEN INVESTING IN MANAGED FUNDS. WHEN CONSIDERING ALTERNATIVE INVESTMENTS, INCLUDING HEDGE FUNDS, YOU SHOULD CONSIDER VARIOUS RISKS INCLUDING THE FACT THAT SOME PRODUCTS: OFTEN ENGAGE IN LEVERAGING AND OTHER SPECULATIVE INVESTMENT PRACTICES THAT MAY INCREASE THE RISK OF INVESTMENT LOSS, CAN BE ILLIQUID, ARE NOT REQUIRED TO PROVIDE PERIODIC PRICING OR VALUATION INFORMATION TO INVESTORS, MAY INVOLVE COMPLEX TAX STRUCTURES AND DELAYS IN DISTRIBUTING IMPORTANT TAX INFORMATION, ARE NOT SUBJECT TO THE SAME REGULATORY REQUIREMENTS AS MUTUAL FUNDS, OFTEN CHARGE HIGH FEES, AND IN MANY CASES THE UNDERLYING INVESTMENTS ARE NOT TRANSPARENT AND ARE KNOWN ONLY TO THE INVESTMENT MANAGER.
John Mauldin Archive |
© 2005-2022 http://www.MarketOracle.co.uk - The Market Oracle is a FREE Daily Financial Markets Analysis & Forecasting online publication.