


Stock Market Update: Reacting to Price Movements in Realtime
Stock-Markets / US Stock Markets Jan 06, 2008 - 03:46 PM GMTBy: Dominick
 Back in January 2007, this update promised volatility for the new year and, now that it's in the history books, we know that promise was delivered: 2007 was the year of volatility. Last week's update said to expect the volatility will continue – it didn't abandon the possibility of new highs in the S&P, but did express some skepticism about the Dec. 30 rally, which suggested more work needed to be done on the downside. And, after the holiday celebration, the market got exactly that, with Friday's slide into the close erasing December's gains and again making good on the promise of volatility.
To really get a handle on what this volatility means, take a long look at the chart below. The rally up the wall of worry in 2006 was contained to a range of about 30 points. But then 2007 came in and expanded that range to about 200 points.
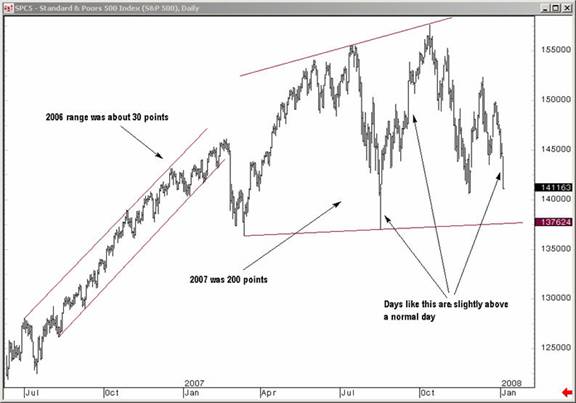
You've heard me call volatility a trader's paradise several times over the past few months and so far 2008 is looking just as good if not better. In a volatile market like 2007 and today, moving 20-30 points in the S&P over a single day is not unusual – and trader's would welcome those moves every single day! Still, down 38 points on Friday and all you hear about over the weekend is the market meltdown and the coming recession.
But this action isn't outside our expectations for this market, and we've seen much worse. The trouble with volatility, though, the reason why it's a dirty word for so many, is that it means the buy and hold camp makes no money. A key takeaway from the chart above is the index is roughly flat from January 3, 2007 to the close Friday on January 04, 2008 . Only traders make money in these markets!
Yes, there are periods of time where buy and hold works, 1995-2000 for example, and if you hold long enough you're bound to hit a few of those periods and do alright. Longtime readers might notice the chart above begins where I made my 1360 call in the S&P which yielded 150 points in less than six months. Buy and hold could have worked in a steadily grinding market like that, too.
But, if you're like me and you want to make money every year, whatever the market's doing, you need to do more than buy and hold. Traders know how to handle, in fact thrive on, volatility because they have the right market tools, manage multiple timeframes, and separate trade from analysis. Doing that means being neither bull nor bear, just looking for the next 30 to 50 points wherever they may be.
Now, if ever there was a week in which every major market hinged upon the next move, it's next week. The professionals are all watching the same area, the same pattern, but the direction from there has not been decided. Blindly picking one side or the other ahead of time because of a bias, or even worse, what you heard on the TV, is like gambling. Watching the signs and trading with the market is the surest way to win.
that, believe it or not, say this move to the downside is at or near its limit, at least for a tradable bounce. And this is what it means to separate trade from analysis: the bears have been right so far this year, and the trend may continue to be downward for months, but that doesn't mean now is the time to get short if the next move is higher.
Now, again, I'm not guaranteeing a bounce early next week, just saying that as of the time of writing this, the market shows no evidence of truly breaking down, while there are signs of a bounce. These signs come from various market tools including a put/call ratio well over 100 for several days, high trin readings, and sentiment tilted profoundly towards the bearish side – and all this as we approach the all-important line in the sand, not yet having gone through it!
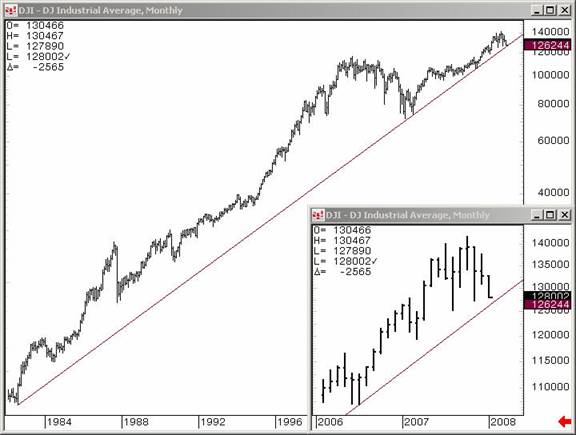
Trendline work is fairly common, but I'd doubt that most analysts are watching this line, even if they have data going back that far. This, to me, is a very real and valid trendline to which, as the close-up shows, we're not yet arrived, but are very close. Even the first '06-07 chart above shows support ahead, not a free fall. The chart above is not our ultimate line in the sand, just an illustration of the support that's waiting at or below current levels and makes us tend to think the market probably does not immediately collapse from here.
In fact, the market could blast off next week after fulfilling the contracting triangle we've been watching since last summer. Many traders see this triangle now, but might be afraid to trade it after a week like we just saw. Even better. There's also the possibility the downward move to date has been a complex corrective pattern so that the market starts grinding slowly higher from here on its own. Respecting all these possibilities is what it means to be unbiased.
Still, I'd have lingering doubts about an immediate breakdown simply from the fact that we never finished 5 waves up in any of the major U.S. markets, let alone all the other evidence. I've said repeatedly my focus is always on catching the next move, not on calling tops or bottoms, because I'm trying to make money, not write a book or make a famous market call. Even if the triangle we have been following for months breaks, it gave us the opportunity to trade long and short as the markets went nowhere since the summer . Of course, any analyst can tell you it's bearish to break through potential support levels, but it takes a trader to make money in real time as the markets react to them, even if that means getting long when everyone is screaming recession and crash. If we do get a bounce and it does not evolve into anything more, we'll have to accept that, too.
So yes, the market looks tired as of Friday's close and analysts can continue to paint bearish pictures, especially if we get any sort of breakdown on Monday, but going against the grain is something we traders do frequently at TTC. My ultimate line in the sand, reserved for members, is a bit lower than most are looking, and until we lose that area I will trade this decline as a consolidation and a correction.
And not the least of my concern is the possibility of an emergency rate cut from the Fed. I discussed this with Joe, author of Precious Points, and his feeling is the Fed probably doesn't want to cut rates much further, though they probably will have to at their next meeting, and that it would take crisis in some financial institution or credit market to trigger an emergency cut, not just a selloff in stocks. Still, I wouldn't put it past them to shock the markets by cutting rates Monday or Tuesday, and carrying leveraged short trades overnight is something I'd advise against for the foreseeable future.
That said, whether it's by emergency rate cut or a purely technical move, I see a down 38 point day as par for the course, been there, done that, and see a tradable bounce as a likely for next week. Even so, as I tell many prospective members who inquire about a pay newsletter, I make money by having nimble, real-time analysis since, particularly in a volatile market, outlooks can evolve quickly. It makes no sense for me to charge for a guess on Saturday when members at TTC are going to get real, tradable setups everyday in my daily pre-market and intra-day posts for less than the price of a pack-a-day smoking habit!
What it comes down to is that 2008 is going to be another awesome year for traders. Do you have what it takes to capitalize on the volatility in real time? In a market like we're seeing, you can make your whole year in a good day or two, but only if you stay on top of your game. If you're less than excited about your 2007 returns, or even just want to do better at catching the intraday moves in 2008, I'm confident TTC is the place for you. And, there's never been a better time to join.
You see, TTC we be raising its monthly membership fee in February and look to close its doors to retail members sometime in the first half of the year. Institutional traders have become a major part of our membership and we're looking forward to making them our focus. If you're a retail trader/investor the only way to get in on TTC's proprietary targets, indicators, forums and real time chat is to join before the lockout starts, and if you join before February, you can still take advantage of the current low membership fee of $89. Once the doors close to retail members, the only way to get in will be a waiting list that we'll use to accept new members from time to time, perhaps as often as quarterly, but only as often as we're able to accommodate them. Don't get locked out later, join now!
Have a profitable and safe week trading, and remember:
"Unbiased Elliott Wave works!"
By Dominick
www.tradingthecharts.com
If you've enjoyed this article, signup for Market Updates , our monthly newsletter, and, for more immediate analysis and market reaction, view my work and the charts exchanged between our seasoned traders in TradingtheCharts forum . Continued success has inspired expansion of the “open access to non subscribers” forums, and our Market Advisory members and I have agreed to post our work in these forums periodically. Explore services from Wall Street's best, including Jim Curry, Tim Ords, Glen Neely, Richard Rhodes, Andre Gratian, Bob Carver, Eric Hadik, Chartsedge, Elliott today, Stock Barometer, Harry Boxer, Mike Paulenoff and others. Try them all, subscribe to the ones that suit your style, and accelerate your trading profits! These forums are on the top of the homepage at Trading the Charts. Market analysts are always welcome to contribute to the Forum or newsletter. Email me @ Dominick@tradingthecharts.com if you have any interest.
This update is provided as general information and is not an investment recommendation. TTC accepts no liability whatsoever for any losses resulting from action taken based on the contents of its charts, commentaries, or price data. Securities and commodities markets involve inherent risk and not all positions are suitable for each individual. Check with your licensed financial advisor or broker prior to taking any action.
Dominick Archive |
© 2005-2022 http://www.MarketOracle.co.uk - The Market Oracle is a FREE Daily Financial Markets Analysis & Forecasting online publication.