


Gold Hits New All Time High?
Commodities / Gold & Silver Jan 06, 2008 - 04:27 PM GMTBy: Merv_Burak

 A good week. Was it a new all time high? And even if it was, so what? Some comments below.
NEW ALL TIME GOLD HIGH ??
There was some comment in the media about gold making a new all time high on Wednesday. Did it? And if it did, what does it mean?
First, there are different sources for gold prices and they all do not necessarily agree with each other. Back in the late 1980s when I started using a computer data source and had downloaded historical data I was using a variety of data vendors and do not recall which vendor data finally ended up in my files. So one might claim that my data may not be accurate but here goes anyway.
Per my data, gold hit an all time intra-day high of $893.50 on 21 Jan 1980 . Actually, that was also the opening price for that day and the rest of the day's trading was all down hill closing at $859.20, the highest closing price until last Wednesday. So, although Wednesday has seen the highest closing price we still have not breached the highest intra-day price. But as I said above, so what?
Technicians such as myself use previous activity to define levels of price resistance and support. Previous highs are often levels of resistance to future moves just as previous lows are considered support levels for future moves. Once a support or resistance level is breached one can expect a continuing move until the next level of support or resistance is reached. If an all time high is breached and there is no further resistance level ahead one can then expect the move to continue for some time, sometimes, an explosive upside move takes place. I wouldn't go into the logic behind all this but it involves investor/speculator/gambler remembering missed opportunities at those previous levels. The extent of these missed opportunities defines the strength of the support or resistance level.
Now, I am sure there are many speculators who were waiting for gold to break into new high territory for such a possible explosive upside move. However, the previous all time high occurred in 1980. How many of THOSE speculators are still around, AND still active in the market. Not many I would venture to guess. And if there are few old timers still active in the market then that all time high has very little impact on the price breach. The price action since making a new all time high on Wednesday was no great shakes. Maybe once all the speculators are back in the game this coming week we will see better action but there still is that all time intra-day high to overcome.
Don't focus on THOSE old time highs, focus on the continuing recent price/volume action to understand what's going on in the present.
GOLD: LONG TERM
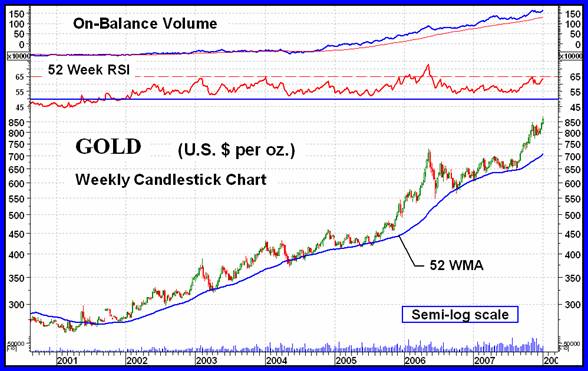
Shown above is a weekly chart of gold since the start of this gold bull market along with some very long term indicators. My usual long term moving average line is a weighted 40 week moving average while the one shown is a yearly (52 week) simple average line. Also shown is a 52 week RSI while my normal long term RSI is a 30 week version. The On-Balance Volume indicator is shown with a 52 week moving average while my normal long term volume trigger line is an 89 day moving average line.
What this chart shows is that once all the indicators were in place in late 2001 gold never looked back. Although there were a few times along the way that gold moved below this moving average line the line slope never reversed to the down side and gold just moved back above the line and continued on its way. I place far more emphasis on the moving average line turning for a reversal signal than I do on the price just moving below the line. You avoid many whip-saws that way. The momentum indicator had reached its overbought line a few times along the way. This indicated that the price was getting a little ahead of itself and reactions took place with the price moving back towards its moving average line. We are once more in just such a location so a hesitation period with some downside action would not be unexpected ahead. When? Let's wait and let the action tell us. As for the volume indicator, it suggests that the real major upside volume action did not start until mid-2004, and continues to this day.
As long as the very long term moving average line remains in a positive slope and the 52 week RSI remains above its neutral (50%) line and the volume indicator remains above its moving average line we continue in a very long term BULL market in gold.
As for the normal long term prognosis, well gold continues above its long term moving average line and the momentum continues in its positive zone all is still BULLISH . At the present time the momentum indicator is giving us a cautionary sign as it HAS NOT made new highs along with the price. Volume is also lagging a little but that can be a result of the holidays.
INTERMEDIATE TERM
The intermediate term may be handled quickly. Gold is above its positive sloping moving average line. The intermediate term momentum is in its positive zone BUT giving us a negative divergence potential as it has not made a new high with the price. Putting these two together gives us a continuing BULLISH rating for the intermediate term.
SHORT TERM
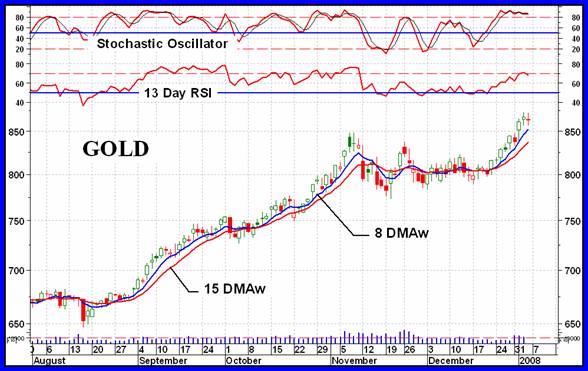
Although it was a shortened week it was an interesting week with gold closing at new all time highs (see comment earlier). Unfortunately, momentum has not kept pace with the price action and is giving us a negative divergence signal at this time. For the signal to have any meaning we must wait for the price to react from a high and THEN check if the momentum had not reached a similar high. I mentioned the diverging short and very short term moving average lines last week. They continue to diverge which suggests a strong price move. I mentioned the momentum weakness above.
The short term momentum can be seen on the chart as getting continually weaker for some time. Its two previous highs were well in the overbought zone while this time it has barely reached the overbought line. It seems to be reacting downward from the line and this may be a suggestion of price reaction to come. The more aggressive Stochastic Oscillator continues inside its overbought zone but a careful look suggests it too is getting weaker and slowly turning downward. Although everything is still BULLISH on the short term there is enough warnings of weakness that a reversal would not be unexpected.
NORTH AMERICAN GOLD INDICES
It was a very good week for the five major North American Indices that I review in rotation in this section. The S&P/TSX Global Gold Index really zoomed upwards during the week with a 10.8% gain mostly due to a good % move by heavily weighted Barrick Gold. However, the S&P/TSX Global Gold Index is still the only one of the five that has not yet exceeded its May 2006 high. This is probably due to the strength in the Canadian $ versus the U.S. $ reducing the performance of the Canadian stocks, % wise.
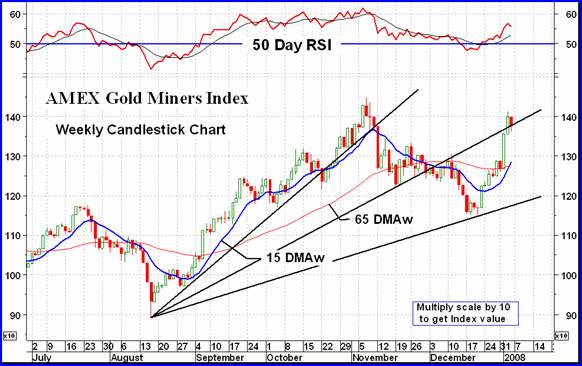
The AMEX Gold Miners Index shown this week is typical of the rest of the Indices. A sharp rise during the past several days with a reversal on Friday. The Index has not quite made a new high as did gold so it and the rest are under performing gold, regardless of % moves. We see here a decelerating FAN line. The action during the week exceeded its boundary just a little so we have two possibilities if these FANS are for real. First, the Index can stay inside the upper boundary, moving higher just above the second FAN trend line. Second, it could quickly reverse to get back into the lower boundary and then move towards the lower, third FAN trend line. If it does that the real test will come when it reaches that line. Should it break below that line then that will confirm an intermediate term bear trend in progress. Let's see which of these scenarios plays out.
MERV'S PRECIOUS METALS INDICES
With snow on the outside and a wet basement on the inside I have fallen somewhat behind in this commentary. I think I will leave the analysis of the various Merv's Indices for next week. However I did mention that I would have a performance comparison of the various Table Indices so here it is.
Please note the following about the performance comparison.
No attempt was made to take into account of currency variations. With the US $ declining versus almost every country the US Indices therefore performed better than Indices from other countries by the amount of currency differences during the respective time period. As an example, over the past 5 years the Canadian $ increased in value by over 60% versus the US $. Therefore when measuring the performance of the Canadian Indices versus the US Indices this should be kept in mind.
The performances are based upon the last WEEKLY closing prices of the respective years. At times this may not represent the last yearly daily price.
The top three performances in each period are highlighted. YELLOW for the best performance, GREY for the second best and GREEN for the third best.
Not all Indices started their individual bull moves at the same time. The performance column for the START OF BULL is the performance from the start of each individual Index bull move.
That's it for today.
By Merv Burak, CMT
Hudson Aero/Systems Inc.
Technical Information Group
for Merv's Precious Metals Central
Web: www.themarkettraders.com
e-mail: merv@themarkettraders.com
Before you invest, Always check your market timing with a Qualified Professional Market Technician
For DAILY Uranium stock commentary and WEEKLY Uranium market update check out my new Technically Uranium with Merv blog at www.techuranium.blogspot.com .
During the day Merv practices his engineering profession as a Consulting Aerospace Engineer. Once the sun goes down and night descends upon the earth Merv dons his other hat as a Chartered Market Technician ( CMT ) and tries to decipher what's going on in the securities markets. As an underground surveyor in the gold mines of Canada 's Northwest Territories in his youth, Merv has a soft spot for the gold industry and has developed several Gold Indices reflecting different aspects of the industry. As a basically lazy individual Merv's driving focus is to KEEP IT SIMPLE .
To find out more about Merv's various Gold Indices and component stocks, please visit www.themarkettraders.com and click on Merv's Precious Metals Central . There you will find samples of the Indices and their component stocks plus other publications of interest to gold investors. While at the themarkettraders.com web site please take the time to check out the Energy Central site and the various Merv's Energy Tables for the most comprehensive survey of energy stocks on the internet. Before you invest, Always check your market timing with a Qualified Professional Market Technician
Merv Burak Archive |
© 2005-2022 http://www.MarketOracle.co.uk - The Market Oracle is a FREE Daily Financial Markets Analysis & Forecasting online publication.