The Debt Deleveraging Big Lie
Politics / US Debt Mar 06, 2012 - 02:25 PM GMTBy: James_Quinn
Cause, Effect & The Fallacy Of Return To Normalcy
 “Thousands upon thousands are yearly brought into a state of real poverty by their great anxiety not to be thought of as poor.” - Robert Mallett
I hear the term de-leveraging relentlessly from the mainstream media. The storyline that the American consumer has been denying themselves and paying down debt is completely 100% false. The proliferation of this Big Lie has been spread by Wall Street and their mouthpieces in the corporate media. The purpose is to convince the ignorant masses they have deprived themselves long enough and deserve to start spending again. The propaganda being spouted by those who depend on Americans to go further into debt is relentless. The “fantastic” automaker recovery is being driven by 0% financing for seven years peddled to subprime (aka deadbeats) borrowers for mammoth SUVs and pickup trucks that get 15 mpg as gas prices surge past $4.00 a gallon. What could possibly go wrong in that scenario? Furniture merchants are offering no interest, no payment deals for four years on their product lines. Of course, the interest rate from your friends at GE Capital reverts retroactively to 29.99% at the end of four years after the average dolt forgot to save enough to pay off the balance. I’m again receiving two to three credit card offers per day in the mail. According to the Wall Street vampire squids that continue to suck the life blood from what’s left of the American economy, this is a return to normalcy.

The definition of normal is: “The usual, average, or typical state or condition”. The fallacy is calling what we’ve had for the last three decades of illusion – Normal. Nothing could be further from the truth. We’ve experienced abnormal psychotic behavior by the citizens of this country, aided and abetted by Wall Street and their sugar daddies at the Federal Reserve. You would have to be mad to believe the debt financed spending frenzy of the last few decades was not abnormal.

The Age of Illusion
"Illusions commend themselves to us because they save us pain and allow us to enjoy pleasure instead. We must therefore accept it without complaint when they sometimes collide with a bit of reality against which they are dashed to pieces." - Sigmund Freud
In my last article Extend & Pretend Coming to an End, I addressed the commercial real estate debacle coming down the pike. I briefly touched upon the idiocy of retailers who have based their business and expansion plans upon the unsustainable dynamic of an ever expanding level of consumer debt doled out by Wall Street banks. One only has to examine the facts to understand the fallacy of a return to normalcy. We haven’t come close to experiencing normalcy. When retail sales, consumer spending and consumer debt return to a sustainable level of normalcy, the carcasses of thousands of retailers will litter the highways and malls of America. It will be a sight to see. The chart below details the two decade surge in retail sales, with the first ever decline in 2008. Retail sales grew from $2 trillion in 1992 to $4.5 trillion in 2007. The Wall Street created crisis in 2008/2009 resulted in a decline to $4.1 trillion in 2009, but the resilient and still delusional American consumer, with the support of their credit card drug pushers on Wall Street, set a new record in 2011 of $4.7 trillion.
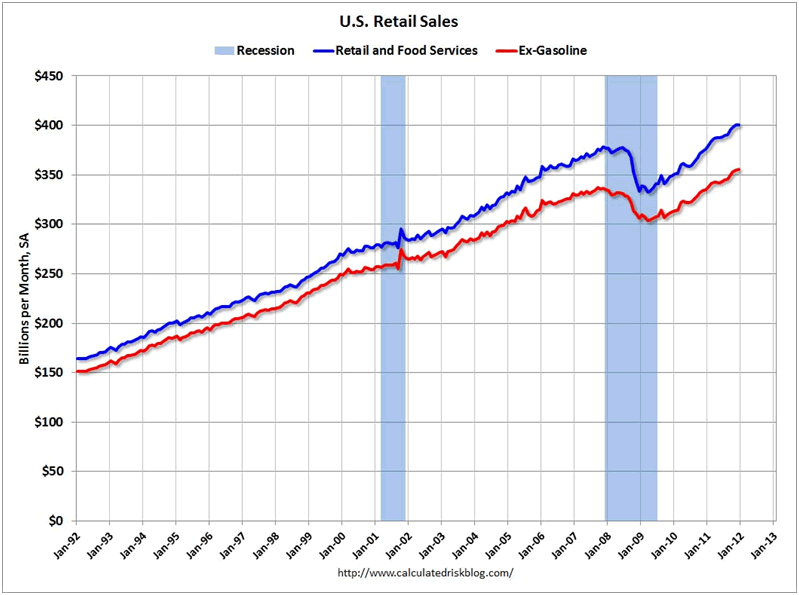
A two decade increase in retail sales of 135% might seem reasonable and normal if wages and household income had grown at an equal or greater rate. But total wages only grew by 125% over this same time frame. Interestingly, the median household income only grew from $30,600 to $49,500, a 62% increase over twenty years. It seems the majority of the benefits accrued to the top 20%, with their aggregate share of the national income exceeding 50% today, versus 47% in 1992 and 43% in the early 1970s. The top 5% are taking home in excess of 21% of the national income versus less than 19% in 1992 and 16% in the early 1970s. It appears the financialization of America, after Nixon closed the gold window and allowed unlimited money printing by the Federal Reserve, has benefitted the few, at the expense of the many. The bottom 80% of households has seen their share of the national income steadily decrease since the early 1970s. There are 119 million households in the United States and 95 million of these households have seen their wages and income stagnate. One might wonder how the 80% were able to fuel a two decade surge in retail sales with such pathetic wage growth.
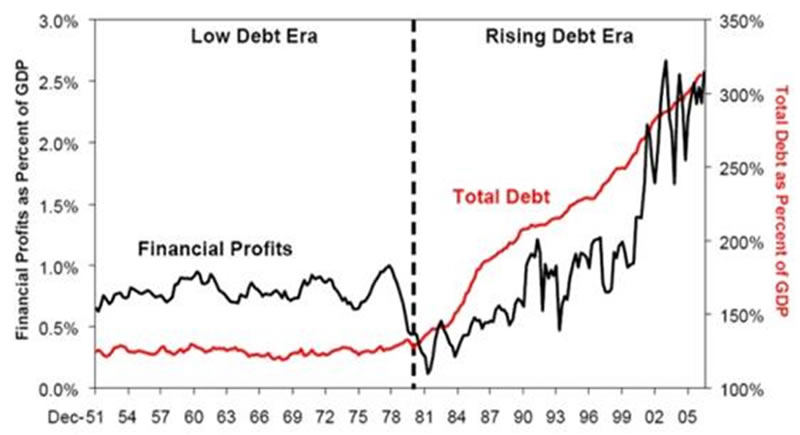
Your friendly Wall Street banker stepped into the breach and did their part to aid a vast swath of Americans to enslave themselves in debt. As the chart above reveals, the slave owners on Wall Street have been the chief beneficiary of the decades long debt deluge. It seems that charging 18% interest on hundreds of billions in credit card debt can be extremely profitable for the shyster charging the interest. Decades of mailing millions of credit card offers, inundating financially ignorant Americans with propaganda media messages convincing them they needed a bigger house, fancier car, or latest technological gadget and creating complex derivatives that permitted banks to market debt to people guaranteed not to pay them back but not care since they sold the packages of these toxic AAA rated loans to pension funds and little old ladies, has done wonders for earnings per share, stock option awards, executive salaries and bonus pools. It hasn’t done wonders for the net worth of the average American who has been entrapped in the chains of debt, forged link by link over decades of purposeful deception and willful delusion.
The 135% increase in retail sales over two decades may have been slightly enhanced by the 213% increase in consumer credit outstanding. Consumer revolving credit rose from $800 billion to the current level of $2.5 trillion over the last two decades. Those 15 credit cards in our possession were so easy to use that we financed our trips to Dollywood, Sandals, and Euro-Disney, in addition to financing our 72 inch 3D HDTVs, granite countertops, stainless steel appliances, decks, pools, recliners with a built in fridges, home theatre rooms, Coach pocketbooks, Jimmy Cho shoes, Rolex watches, yachts, bigger and better boobs, and of course our smokes and beer. Much has been made about the great de-leveraging by the American consumer. There’s just one inconvenient fact – it hasn’t happened - yet.
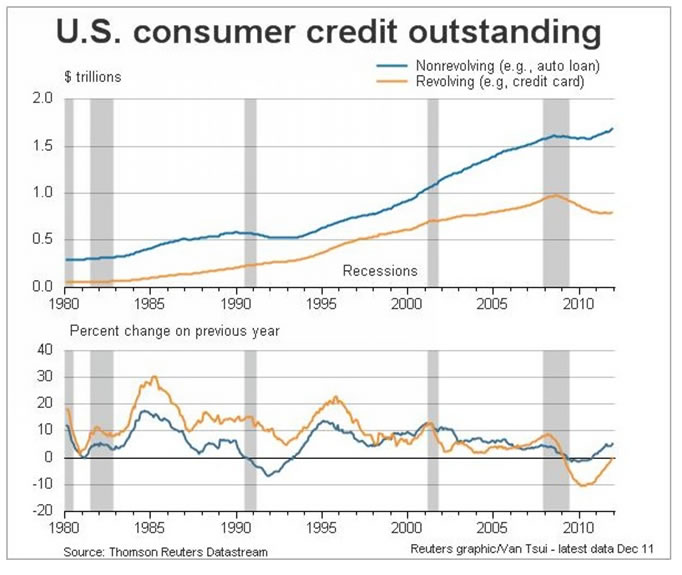
Total consumer credit outstanding peaked at $2.58 trillion in July 2008. Today it stands at $2.50 trillion. Revolving credit card debt peaked at $972 billion in September 2008 and subsequently declined to $790 billion by April 2011. It now stands at $801 billion, as living well beyond our means has resumed its appeal. Meanwhile, non-revolving credit for automobiles, boats, student loans, and mobile homes peaked at $1.61 trillion in July 2008 and “crashed” all the way down to $1.58 trillion in May 2010. Once Bennie fired up the printing presses, the government car companies decided to make subprime auto loans again and the Federal government started doling out student loans like a pez dispenser, all was well in the non-revolving consumer loan world. The debt outstanding has soared to $1.7 trillion, a full $90 billion above the pre-crash peak. So, after three and a half years of “austerity” and supposed deleveraging, consumer debt outstanding has fallen by 3%.
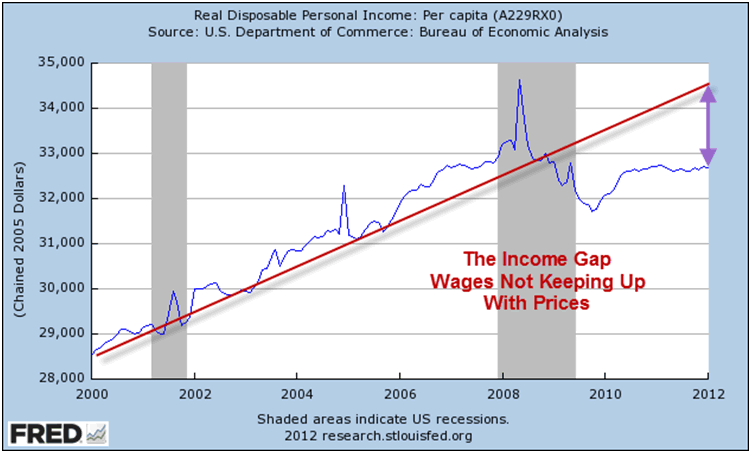
The Big Lie of austerity and consumer deleveraging is unquestioned by the talking heads in the mainstream media. They are incapable or unwilling to examine the actual data which substantiates the fact that Americans have NOT deleveraged and have NOT taken austerity to heart. The most basic facts fly in the face of consumers even having the wherewithal to pay down their debt. Median household income has declined from $50,300 in 2008 to $49,400 today. There are 5 million less people employed today than employed in 2008. Total wages in the country have only grown from $6.6 trillion in 2008 to $6.8 trillion today. This increase was concentrated among the .01%, who do not carry credit card debt. They profit from credit card debt. Real disposable personal income has fallen by 5% since the peak in 2008 as Bernanke’s Wall Street bailout zero interest rate policy has caused prices for everything except our houses to surge. The people carrying most of the credit card debt are the least able to pay it off. These are the same people who have swelled the food stamp rolls from 28 million in 2008 to 46.5 million today.
A CNBC bubble headed arrogant bimbo might sarcastically ask, “If the American consumer isn’t deleveraging, than how did revolving credit card debt drop by $182 billion over three years?” Rather than do the minimal research needed to find the answer, they would rather parrot the company/government line. The chart below, compiled from Federal Reserve data, provides the answer. The Wall Street banks have written off $193.3 billion of bad debt since 2008. Now for some basic math, that will probably be over the head of most Wall Street analysts and CNBC parrots. If you start with $972 billion of credit card debt and you write-off $200 billion (assuming another $7 billion in the 4th Quarter of 2011) and your ending balance is $801 billion, how much debt did the American consumer pay down? It’s a trick question. The American consumer ADDED $29 billion of credit card debt since 2008 to go along with the $90 billion of auto and student loan debt ADDED onto their aching backs. So much for the deleveraging storyline. It’s comforting to convince ourselves we’ve changed, but we haven’t. And the powers that be need you to keep believing, so they can continue to keep you enslaved and under their thumbs.
Consumer Credit Card Debt and Charge-off Data (in Billions):
Outstanding Revolving Consumer Debt |
Outstanding Credit Card Debt |
Quarterly Credit Card Charge-Off Rate |
Quarterly Credit Card Charge-Off in Dollars |
|
Q3 2011 |
$793.4 |
$777.5 |
5.63% |
$10.9 |
Q2 2011 |
$787.4 |
$771.7 |
5.58% |
$10.8 |
Q1 2011 |
$779.6 |
$764.0 |
6.96% |
$13.3 |
2010 |
$826.7 |
$810.2 |
$75.1 |
|
Q4 2010 |
$825.7 |
$810.2 |
7.70% |
$15.6 |
Q3 2010 |
$806.9 |
$790.8 |
8.55% |
$16.9 |
Q2 2010 |
$817.4 |
$801.1 |
10.97% |
$22.0 |
Q1 2010 |
$828.5 |
$811.9 |
10.16% |
$20.6 |
2009 |
$894.0 |
$876.1 |
$83.2 |
|
Q4 2009 |
$894.0 |
$876.1 |
10.12% |
$22.2 |
Q3 2009 |
$893.5 |
$875.6 |
10.1% |
$22.1 |
Q2 2009 |
$905.2 |
$887.1 |
9.77% |
$21.6 |
Q1 2009 |
$923.3 |
$904.8 |
7.62% |
$17.2 |
Q4 2008 |
$989.1 |
$969.3 |
(Source: CardHub.com, Federal Reserve)
Loving Our Servitude
“There will be, in the next generation or so, a pharmacological method of making people love their servitude, and producing dictatorship without tears, so to speak, producing a kind of painless concentration camp for entire societies, so that people will in fact have their liberties taken away from them, but will rather enjoy it, because they will be distracted from any desire to rebel by propaganda or brainwashing, or brainwashing enhanced by pharmacological methods. And this seems to be the final revolution.” Aldous Huxley
The American people have come to love their servitude through a combination of self- delusion, corporate mass media propaganda, and an irrational desire to appear successful without making the necessary sacrifices required to become successful. The drug of choice used to corral the masses into their painless concentration camp of debt has been Wall Street peddled financing. Can you think of a better business model than being a Wall Street bank? You hand out 500 million credit cards to 118 million households, even though 60 million of the households make less than $50,000. You then create derivatives where you package billions of subprime credit card debt and convince clueless dupes to buy this toxic debt as if it was AAA credit. When the entire Ponzi scheme implodes, you write-off $200 billion of bad debt and have the American taxpayer pick up the tab by having your Ben puppet at the Federal Reserve seize $450 billion of interest income from senior citizens and re-gift it to you through his zero interest rate policy. You then borrow from the Federal Reserve at 0% and charge an average interest rate of 15% on the $800 billion of credit card debt outstanding, generating $120 billion of interest and charging an additional $22 billion of late fees. Much was made of the closing of credit card accounts after the 2008 financial implosion, but most of the accounts closed were old unused credit lines. Now that the American taxpayer has picked up the tab for the 2008 debacle, the Wall Street banks are again adding new credit card accounts.
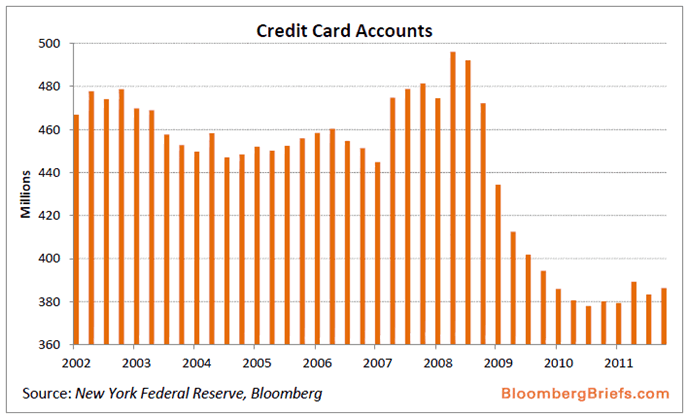
With 40% of all credit card users carrying a revolving balance averaging $16,000, they are incurring interest charges of $2,400 per year. Some of the best financial analysts in the blogosphere have been misled by the propaganda spewed by the Wall Street media shills at Bloomberg and CNBC. The following chart, which includes mortgage and home equity debt, gives the false impression households are sensibly deleveraging, as household debt as a percentage of disposable personal income has fallen from 115% in June 2009 to 101% today. As I’ve detailed ad nauseam, $200 billion of the $1.2 trillion of “household deleveraging” was credit card write-offs. The vast majority of the remaining $1 trillion of “deleveraging” could possibly be related to the 5 million completed foreclosures since 2009. Of course, this pales in comparison to the unbelievably foolhardy mortgage equity withdrawal of $3 trillion between 2003 and 2008 by the 1% wannabes. Bloomberg might be a tad disingenuous by excluding the $1 trillion of student loan from their little chart. If student loan debt is included, household debt outstanding surges to $11.5 trillion.
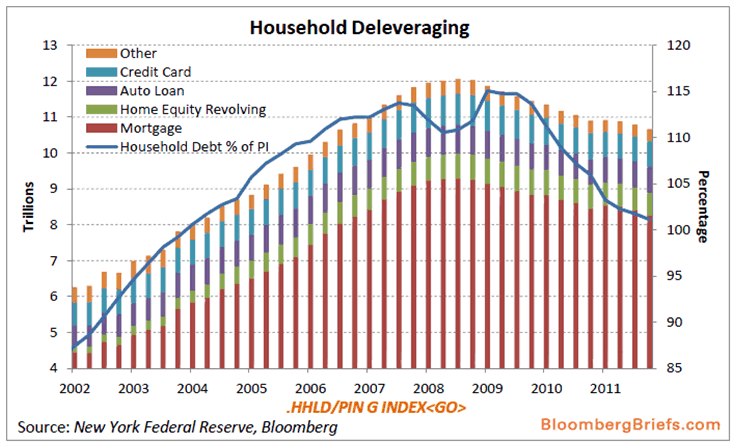
Based on the Bloomberg chart you would assume wrongly that American consumers are using their rising incomes to pay down debt. Besides not actually reducing their debts, the disposable personal income figure provided by the government drones at the BEA includes government transfer payments for Social Security, Medicare, Medicaid, unemployment compensation, food stamps, veterans benefits, and the all- encompassing “other”. Disposable personal income in the 2nd quarter of 2008 reached $11.2 trillion. It has risen by $500 billion, to $11.7 trillion by the end of 2011. Coincidentally, government social transfers have risen by $400 billion over this same time frame, a 20% increase. Excluding government transfers, disposable personal income has risen by a dreadful 1.1%. For the benefit of the slow witted in the mainstream media, every penny of the social welfare transfers has been borrowed. Only a government bureaucrat could believe that borrowing money from the Chinese, handing it out to unemployed Americans and calling it personal income is proof of deleveraging and austerity.
Household debt as a percentage of wages in 2008 was 185%. Today, after the banks have written off $1.2 trillion of debt, this figure stands at 169%. Meanwhile, total credit market debt in our entire system now stands at an all-time high of $54 trillion, up $3 trillion from 2007. It stands at 360% of GDP. In 1992, total credit market debt of $15.2 trillion equaled 240% of GDP ($6.3 trillion). Was it a sign of a rational balanced economic system that total credit market debt grew by 355% in the last two decades while GDP grew by only 238%? I think it is pretty clear the last two decades have not been normal or built upon a sustainable foundation. In the three decades prior to 1990 household debt as a percentage of disposable personal income stayed in a steady range between 60% and 80%. The current level of 101% is abnormal. In order to achieve a sustainable normal level of 80% will require an additional $2 trillion of debt destruction. No one is prepared for this inevitable end result. The impact of this “real” deleveraging will devastate our consumer dependent society.
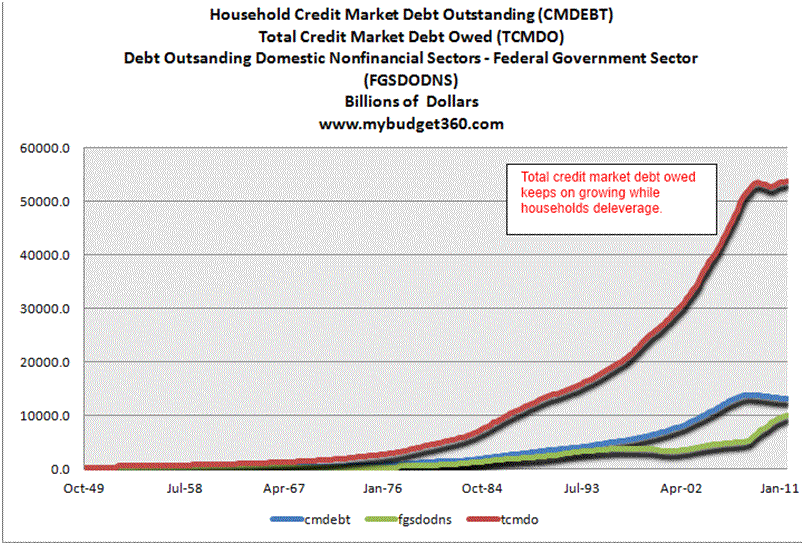
The colossal accumulation of debt in the last two decades was the cause and abnormally large retail sales were the effect. The return to normalcy will not be pleasant for consumers, retailers, mall owners, local governments or bankers.
Demographics are a *****
In addition to an unsustainable level of debt, the pig in the python (also known as the Baby Boomer generation) will relentlessly impact the future of consumer spending and the approaching mass retail closures. Baby Boomers range in age from 51 to 68 today. The chart below details the retail spending by age bracket. Almost 50% of all retail spending is done by those between 35 years old and 54 years old. This makes total sense as these are the peak earnings years for most people and the period in their lives when they are forming households, raising kids and accumulating stuff. As you enter your twilight years, income declines, medical expenses rise, the kids are gone, and you’ve bought all the stuff you’ll ever need. Spending drops precipitously as you enter your 60’s. The spending wave that began in 1990 and reached its apex in the mid-2000s has crested and is going to crash down on the heads of hubristic retail CEOs that extrapolated unsustainable debt financed spending to infinity into their store expansion plans. The added kicker for retailers is the fact Boomers haven’t saved enough for their retirements, have experienced a twelve year secular bear market with another five or ten years to go, are in debt up to their eyeballs, and have seen the equity in their homes evaporate into thin air in the last seven years. This is not a recipe for spending up swell.
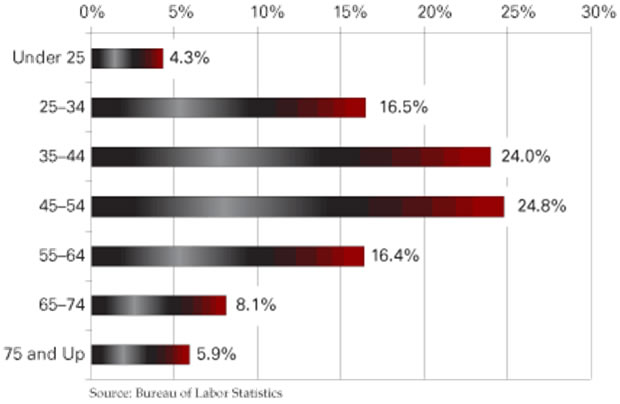
Demographics cannot be spun by the corporate media or manipulated by BLS government drones. They are factual and unable to be altered. They are also predictable. The four population by age charts below paint a four decade picture of reality that does not bode well for retailers over the coming decade. The population by age data correlates perfectly with the spending spree over the last two decades.

- 26% of the population in the prime spending years between 35 and 54 years old.
- Only 14% of the population over 65 years old indicating reduced spending.
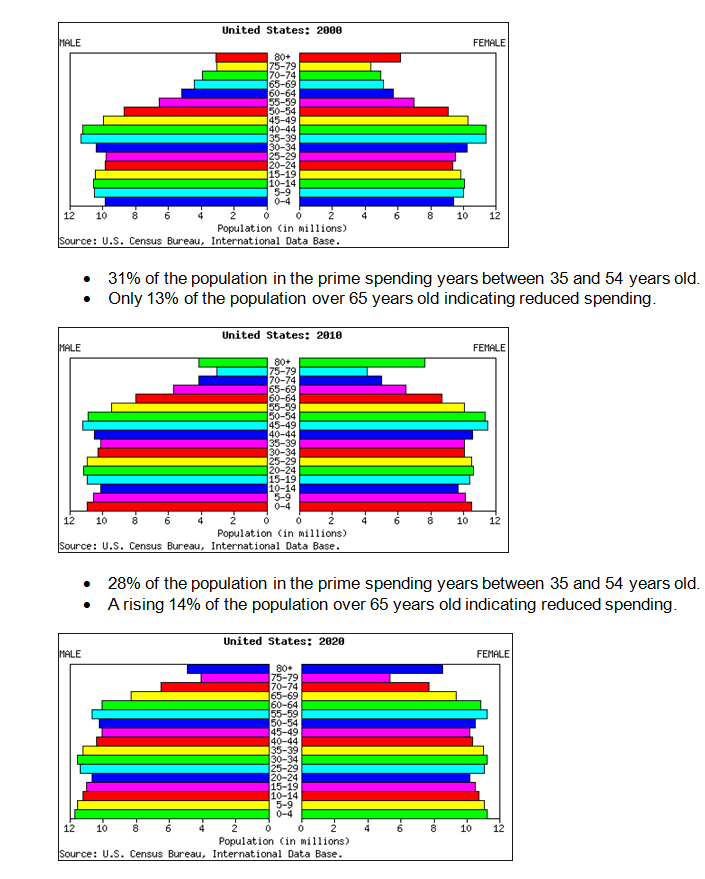
- 24% of the population in the prime spending years between 35 and 54 years old.
- A rising 17% of the population over 65 years old indicating reduced spending.
The irreversible descent in the percentage of our population in the 35 to 54 year old prime spending age bracket will have and is already having a devastating impact on retail sales. In addition, the young people moving into the 25 to 34 year old bracket are now saddled with $1 trillion of student loan debt and worthless degrees from the University of Phoenix and the other for-profit diploma mills, luring millions with their Federal government easy loan programs. The fact that 40% of all 20 to 24 year olds in the country are not employed and 26% of all 25 to 34 year olds in the country are not working may also play a role in holding back spending, as jobs are somewhat helpful in generating money to buy stuff. Even with Obama as President they will have a tough time getting onto the unemployment rolls without ever having a job. The 55 and over crowd, who have lived above their means for three decades, will be lucky if they have the resources to put Alpo on the table in the coming years. The unholy alliance of debt, demographics and delusion will result in a retail debacle of epic proportions, unseen by retail head honchoes and the linear thinkers in the media and government.
We’re Not in Kansas Anymore Toto
“We tell ourselves we’re in an economic recovery, meaning we expect to return to a prior economic state, namely, a turbo-charged “consumer” economy fueled by easy credit and cheap energy. Fuggeddabowdit. That part of our history is over. We’ve entered a contraction that will seem permanent until we reach an economic re-set point that comports with what the planet can actually provide for us. That re-set point is lower than we would like to imagine. Our reality-based assignment is the intelligent management of contraction. We don’t want this assignment. We’d prefer to think that things are still going in the other direction, the direction of more, more, more. But they’re not. Whether we like it or not, they’re going in the direction of less, less, less. Granted, this is not an easy thing to contend with, but it is the hand that circumstance has dealt us. Nobody else is to blame for it.” – Jim Kunstler
The brilliant retail CEOs who doubled and tripled their store counts in the last twenty years and assumed they were geniuses as sales soared are getting a cold hard dose of reality today. What they don’t see is an abrupt end to their dreams of ever expanding profits and the million dollar bonuses they have gotten used to. I’m pretty sure their little financial models are not telling them they will need to close 20% of their stores over the next five years. They will be clubbed over the head like a baby seal by reality as consumers are compelled to stop consuming. As we’ve seen, just a moderation in spending has resulted in a collapse in store profitability. Retail CEOs have failed to grasp that it wasn’t their brilliance that led to the sales growth, but it was the men behind the curtain at the Federal Reserve. The historic spending spree of the last two decades was simply the result of easy to access debt peddled by Wall Street and propagated by the easy money policies of Alan Greenspan and Ben Bernanke. The chickens came home to roost in 2008, but the Wizard of Debt - Bernanke – has attempted to keep the flying monkeys at bay with his QE1, QE2, Operation Twist, and ZIRP. As the economy goes down for the count again in 2012, he will be revealed as a doddering old fool behind the curtain.
There are 1.1 million retail establishments in the United States, but the top 25 mega-store national chains account for 25% of all the retail sales in the country. The top 100 retailers operate 243,000 stores and account for approximately $1.6 trillion in sales, or 36% of all the retail sales in the country. They are led by the retail behemoth Wal-Mart and they dot the suburban landscape from Maine to Florida and New York to California. These super stores anchor every major mall in America. There are power centers with only these household names jammed in one place (example near my home: Best Buy, Target, Petsmart, Dicks, Barnes & Noble, Staples). These national chains had already wiped out the small town local retailers by the early 2000s as they sourced their goods from China and dramatically underpriced the small guys. The remaining local retailers have been closing up shop in record numbers in the last few years as the ability to obtain financing evaporated and customers disappeared. The national chains have more staying power, but their blind hubris and inability to comprehend the future landscape will be their downfall.
Having worked for one of the top 100 retailers for 14 years, I understand every aspect of how these mega-chains operate. They all approach retailing from a very scientific manner. They have regression models to project sales based upon demographics, drive times, education, average income, and the size of the market. They will build any store that achieves a certain ROI, based on their models. The scientific method works well when you don’t make ridiculous growth assumptions and properly take into account what your competitors are doing and how the economy will realistically perform in the future years. This is where it goes wrong as these retail chains get bigger, start believing their press clippings and begin ignoring the warnings of sober realists within their organizations. When the models show that cannibalization of sales from putting stores too close together will result in a decline in profits, the CEO will tweak the model to show greater same store growth and a larger increase in the available market due to higher economic growth. They assume margins will increase based upon nothing. At the same time, they will ignore the fact their competitor is building a store 2 miles away. Eventually, using foolhardy assumptions and ignoring facts leads to declining sales and profitability.
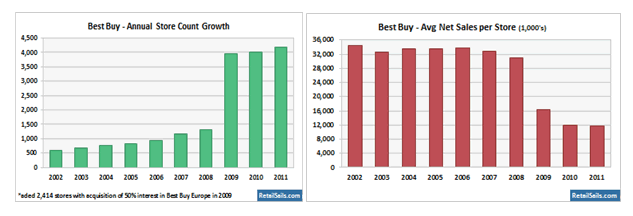
There is no better example of this than Best Buy. They increased their U.S. store count from 500 in 2002 to 1,300 today. That is a 160% increase in store count. For some perspective, national retail sales grew by 42% over this same time frame. Their strategy wiped out thousands of mom and pop stores and drove their chief competitor – Circuit City – into liquidation. But their hubris caught up to them. There sales per store has plummeted from $36 million per store in 2007 to less than $28 million per store today, a 24% decline in just five years. They have cannibalized themselves and have seen a $6 billion increase in revenue lead to $100 million LESS in profits. It appears the 444 stores they have built since 2007 have a net negative ROI. Top management is now in full scramble mode as they refuse to admit their strategic errors. Instead they cut staff and use upselling gimmicks like service plans, technical support and deferred financing to try and regain profitability. They will not admit they have far too many stores until it is too late. They will follow the advice of an earnings per share driven Wall Street crowd and waste their cash buying back stock. We’ve seen this story before and it ends in tears. I was in a Best Buy last week at 6:00 pm and there were at least 50 employees servicing about 10 customers. Tick Tock.
You would have to be blind to not have noticed the decade long battles between the two biggest drug store chains and the two biggest office supply chains. Walgreens and CVS have been in a death struggle as they have each increased their store counts by 80% to 90% in the last 10 years. Both chains have been able to mask poor existing store growth by opening new stores. They are about to hit the wall. I now have six drug stores within five miles of my house all selling the exact same products. Every Wal-Mart and Target has their own pharmacy. At 2:00 pm on a Sunday afternoon I walked into the Walgreens near my house and there were six employees, a pharmacist and myself in the store. This is a common occurrence in this one year old store. It will not reach its 3rd birthday.

Further along on the downward death spiral are Staples and Office Depot. They both increased their store counts by 50% to 60% in the last decade. Despite adding almost 200 stores since 2007, Staples has managed to reduce their profits. Sales per store have declined by 20% since 2006. Office Depot has succeeded in losing almost $2 billion in the last five years. These fools are actually opening new stores again despite overseeing a 36% decrease in sales per store over the last decade. These stores sell paper clips, paper, pens, and generic crap you can purchase at 100,000 other stores across the land or with a click of you mouse. Their business concept is dying and they don’t know it or refuse to acknowledge it.

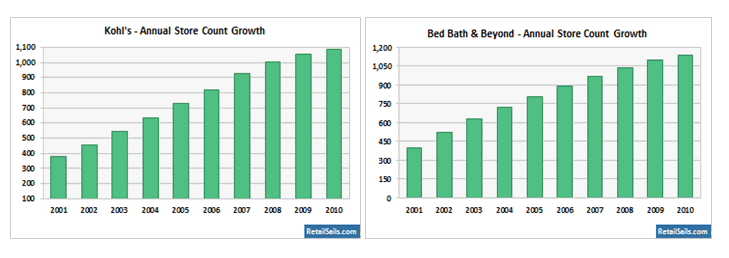
Even well run retailers such as Kohl’s and Bed Bath & Beyond have hit the proverbial wall. Remember that total retail sales have only grown by 42% in the last ten years while Kohl’s has increased their store count by 180% and Bed Bath & Beyond has increased their store count by 175%. Despite opening 200 new stores since 2007, Kohl’s profits are virtually flat. Sales per store have deflated by 26% over the last decade as over-cannibalization has worked its magic. Bed Bath & Beyond has managed to keep profits growing as they drove Linens & Things into bankruptcy, but they risk falling into the Best Buy trap as they continue to open new stores. Their sales per store are well below the levels of 2002. Again, there is very little differentiation between these retailers as they all sell cheap crap from Asia, sold at thousands of other stores across the country. With home formation stagnant, where will the growth come from? Answer: It won’t come at all.
The stories above can be repeated over and over when analyzing the other mega-retailers that dominate our consumer crazed society. Same store sales growth is stagnant. The major chains have over cannibalized themselves. Their growth plans were based upon a foundation of ever increasing consumer debt and ever more delusional Americans spending money they don’t have. None of these retailers has factored a contraction in consumer spending into their little models. But that is what is headed their way. They saw the tide go out in 2009 but they’ve ventured back out into the surf looking for some trinkets, not realizing a tsunami is on the way. The great contraction began in 2008 and has been proceeding in fits and starts for the last four years. The increase in retail sales over the last two years has been driven by inflation, not increased demand. The efforts of the Federal Reserve and Wall Street to reignite our consumer society by pushing subprime debt once more will ultimately fail – again. The mega-retailers will be forced to come to the realization they have far too many stores to meet a diminishing demand.
The top 100 mega-retailers operate 243,000 stores. Will our contracting civilization really need or be able to sustain 14,000 McDonalds, 17,000 Taco Bells & KFCs, 24,000 Subways, 9,000 Wendys, 7,000 7-11s, 8,000 Walgreens, 7,000 CVS’, 4,000 Sears & Kmarts, 11,000 Starbucks, 4,000 Wal-Marts, 1,700 Lowes and 1,800 Targets in five years? As our economy contracts and more of our dwindling disposable income is directed towards rising energy and food costs, retailers across the land will shut their doors. Try to picture the impact on this country as these retailers are forced to close 50,000 stores. Where will recent college graduates and broke Baby Boomers work? The most profitable business of the future will be producing Space Available and For Lease signs. Betting on the intelligence of the American consumer has been a losing bet for decades. They will continue to swipe that credit card at the local 7-11 to buy those Funions, jalapeno cheese stuffed pretzels with a side of cheese dipping sauce, cartons of smokes, and 32 ounce Big Gulps of Mountain Dew until the message on the credit card machine comes back DENIED.
There will be crescendo of consequences as these stores are closed down. The rotting hulks of thousands of Sears and Kmarts will slowly decay; blighting the suburban landscape and beckoning criminals and the homeless. Retailers will be forced to lay-off hundreds of thousands of workers. Property taxes paid to local governments will dry up, resulting in worsening budget deficits. Sales taxes paid to state governments will plummet, forcing more government cutbacks and higher taxes. Mall owners and real estate developers will see their rental income dissipate. They will then proceed to default on their loans. Bankers will be stuck with billions in loan losses, at least until they are able to shift them to the American taxpayer – again. No politician, media pundit, Federal Reserve banker, retail CEO, or willfully ignorant mindless consumer wants to admit the truth that the last three decades of debt delusion are coming to a tragic bitter end. The smarmy acolytes of Edward Bernays on Wall Street and in corporate America have successfully used propaganda and misinformation to lure generations of weak minded people into debt servitude. But, at the end of the day, you need cash to service the debt. Mind control doesn’t pay the bills. We will eventually return to normal, just not the normal many had in mind.
“If we understand the mechanism and motives of the group mind, it is now possible to control and regiment the masses according to our will without them knowing it.” – Edward Bernays
Join me at www.TheBurningPlatform.com to discuss truth and the future of our country.
By James Quinn
James Quinn is a senior director of strategic planning for a major university. James has held financial positions with a retailer, homebuilder and university in his 22-year career. Those positions included treasurer, controller, and head of strategic planning. He is married with three boys and is writing these articles because he cares about their future. He earned a BS in accounting from Drexel University and an MBA from Villanova University. He is a certified public accountant and a certified cash manager.
These articles reflect the personal views of James Quinn. They do not necessarily represent the views of his employer, and are not sponsored or endorsed by his employer.
© 2011 Copyright James Quinn - All Rights Reserved
Disclaimer: The above is a matter of opinion provided for general information purposes only and is not intended as investment advice. Information and analysis above are derived from sources and utilising methods believed to be reliable, but we cannot accept responsibility for any losses you may incur as a result of this analysis. Individuals should consult with their personal financial advisors.
James Quinn Archive |
© 2005-2022 http://www.MarketOracle.co.uk - The Market Oracle is a FREE Daily Financial Markets Analysis & Forecasting online publication.


