Weekly Stock Market Technical Analysis Report - 10th Feb 07
Stock-Markets / Forecasts & Technical Analysis Feb 10, 2007 - 12:35 PM GMTBy: Mike_Burk
The good news is: Same as last week, most of the major indices hit new multiyear or all time highs.
Short Term
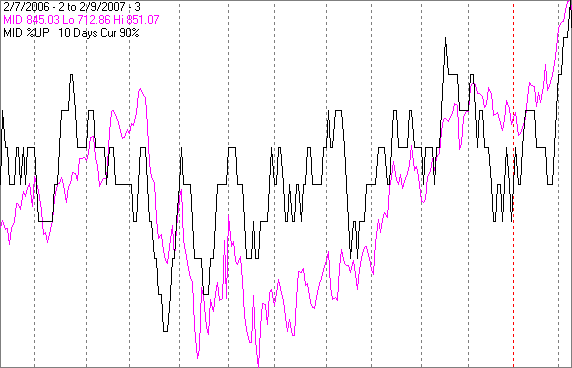
Last week I discussed the implications of the Russell 2000 (R2K) moving up for 6 consecutive days. On Thursday last week the S&P mid cap index (MID) completed a run of 10 consecutive up days, an occurrence seen only twice in the past 15 years
The chart below covers the past year showing the MID in magenta and an indicator showing the percentage of the last 10 trading days that were up in black. The indicator touches the top of the chart when there have been 10 or more consecutive up days and it touches the bottom of the chart when there have been 10 or more consecutive down days.
The indicator hit the top of the screen on Thursday.

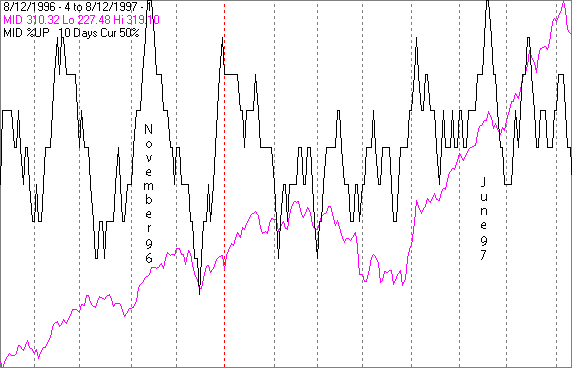
There was a similar run up in November 1996 and again in June 1997. These are shown in the next chart. In November 96 the index stalled for a few days before moving upward a little more after which it declined for two weeks. After an 11 day run up in June 1997 the index declined for a week or two before resuming its move upward.

Ten consecutive up days means the index and market is overbought, but the upward move is likely to resume after a brief period of consolidation.
Intermediate term
Summation indices (SI) are running totals of oscillator values. When the oscillator is above 0 the SI moves upward and when it is below 0 the SI moves downward.
The next chart shows the NASDAQ composite (OTC) in red and SI's from oscillators of NASDAQ advancing - declining issues (AD), new highs - new lows (HL) and upside - downside volume (UD).
All of the SI's are moving upward suggesting there is something left in this rally.
Seasonality
The Uniform Monday Holiday Bill of 1968 made Washington's February 11th birthday a holiday observed on the 3rd Monday in February and called Presidents' day. This holiday was first observed in 1971.
The tables below show data for both the OTC and S&P 500 (SPX) from 1971 - 2003 during the 3rd year of the Presidential Cycle. There are summaries for both the 3rd year of the Presidential Cycle and all years combined.
Next week is the week prior to Presidents' day and it has been a strong.
Both the OTC and SPX have been up 78% of the time with average gains of around 1%. The 3rd year has been stronger than the averages for all years. Over all years the both indices have been up a little over half of the time with modest gains
5 days prior to the Friday before Presidents day.
The number following the year represents its position in the presidential cycle.
The number following the daily return represents the day of the week;
1 = Monday, 2 = Tuesday etc.
| OTC Presidential Year 3 | ||||||
| Day5 | Day4 | Day3 | Day2 | Day1 | Totals | |
| 1971-3 | 0.84% 1 | -0.08% 2 | -0.07% 3 | 0.75% 4 | 0.59% 5 | 2.04% |
| 1975-3 | -0.42% 1 | 0.01% 2 | 1.07% 3 | 1.80% 4 | 0.52% 5 | 2.99% |
| 1979-3 | 0.23% 1 | 0.68% 2 | -0.22% 3 | 0.26% 4 | 0.51% 5 | 1.46% |
| 1983-3 | 0.79% 1 | 0.15% 2 | 0.00% 3 | -0.03% 4 | 0.88% 5 | 1.80% |
| 1987-3 | -0.28% 1 | -0.56% 2 | 0.62% 3 | 0.78% 4 | 0.81% 5 | 1.37% |
| 1991-3 | 1.67% 1 | -0.03% 2 | 0.90% 3 | -0.82% 4 | 0.99% 5 | 2.72% |
| 1995-3 | -0.13% 1 | 0.15% 2 | 0.63% 3 | -0.29% 4 | -0.80% 5 | -0.43% |
| 1999-3 | 1.32% 1 | -3.91% 2 | -0.06% 3 | 4.16% 4 | -3.48% 5 | -1.97% |
| 2003-3 | 1.11% 1 | -0.09% 2 | -1.27% 3 | -0.12% 4 | 2.56% 5 | 2.18% |
| Avg | 0.74% | -0.89% | 0.16% | 0.74% | 0.02% | 0.77% |
| OTC summary for Presidential Year 3 1971 - 2003 | ||||||
| Averages | 0.57% | -0.41% | 0.18% | 0.72% | 0.29% | 1.35% |
| % Winners | 67% | 44% | 56% | 56% | 78% | 78% |
| MDD 2/10/1999 3.97% -- 2/13/2003 1.48% -- 2/17/1995 1.09% | ||||||
| OTC summary for all years 1971 - 2006 | ||||||
| Averages | 0.02% | -0.14% | 0.40% | 0.25% | -0.27% | 0.26% |
| % Winners | 44% | 53% | 72% | 56% | 44% | 58% |
| SPX Presidential Year 3 | ||||||
| Day5 | Day4 | Day3 | Day2 | Day1 | Totals | |
| 1971-3 | 0.54% 1 | 0.06% 2 | -0.12% 3 | 0.53% 4 | 0.53% 5 | 1.54% |
| 1975-3 | -0.34% 1 | 0.28% 2 | 1.71% 3 | 1.36% 4 | 0.60% 5 | 3.61% |
| 1979-3 | 0.34% 1 | 0.74% 2 | -0.06% 3 | -0.14% 4 | -0.06% 5 | 0.82% |
| 1983-3 | 0.87% 1 | -0.42% 2 | -0.59% 3 | 0.01% 4 | 0.38% 5 | 0.26% |
| 1987-3 | -0.66% 1 | -1.12% 2 | 0.90% 3 | -0.69% 4 | 1.48% 5 | -0.10% |
| 1991-3 | 2.57% 1 | -0.84% 2 | 0.96% 3 | -1.30% 4 | 1.33% 5 | 2.72% |
| 1995-3 | 0.04% 1 | 0.19% 2 | 0.41% 3 | 0.14% 4 | -0.67% 5 | 0.11% |
| 1999-3 | 0.36% 1 | -2.23% 2 | 0.61% 3 | 2.49% 4 | -1.91% 5 | -0.68% |
| 2003-3 | 0.76% 1 | -0.81% 2 | -1.27% 3 | -0.16% 4 | 2.14% 5 | 0.66% |
| Avg | 0.61% | -0.96% | 0.32% | 0.10% | 0.48% | 0.54% |
| SPX summary for Presidential Year 3 1971 - 2003 | ||||||
| Averages | 0.50% | -0.46% | 0.28% | 0.25% | 0.43% | 0.99% |
| % Winners | 78% | 44% | 56% | 56% | 67% | 78% |
| MDD 2/9/1999 2.23% -- 2/13/2003 2.22% -- 2/10/1987 1.77% | ||||||
| SPX summary for all years 1971 - 2006 | ||||||
| Averages | 0.00% | 0.05% | 0.29% | -0.05% | -0.16% | 0.14% |
| % Winners | 53% | 58% | 69% | 39% | 33% | 56% |
 |
The Alpha Fund (APHAX)
The Alpha Fund, which I manage, opened last October.
Last week YTD APHAX -0.6% +2.0%. For information about the fund go to: http://www.thealphafunds.com/index.htm .
Conclusion
The market is still overbought, however, some of that overbought condition was relieved Friday and seasonality next week is positive. I expect the major indices to be higher on Friday February 16 than they were on Friday February 9.
After hitting all time or multi year highs on Thursday, all of the major indices declined on Friday leaving them with modest losses for the week making last weeks positive forecast a miss.
By Mike Burke
Mike Burk is an employee and principle of Alpha Investment Management (Alpha) a registered investment advisor. Charts and figures presented herein are believed to be reliable but we cannot attest to their accuracy. The views expressed are provided for information purposes only and should not be construed in any way as investment advice. Furthermore, the opinions expressed may change without notice. To subscribe to this report : http://alphaim.net/signup.html
© 2005-2022 http://www.MarketOracle.co.uk - The Market Oracle is a FREE Daily Financial Markets Analysis & Forecasting online publication.


