


Stock Market Uptrend Likely to Resume Next Week
Stock-Markets / Stock Markets 2012 Mar 24, 2012 - 04:54 PM GMTBy: Tony_Caldaro

 After five weeks of uninterupted gains in the SPX the market pulled back this week and ended with the SPX/DOW -0.85%. The NDX has risen for 12 consecutive weeks, and the NDX/NAZ were +0.50% this week. Foreign market fared much worse. Asian markets lost 1.0%, European market were 2.6% lower, and the DJ World index was down 1.1%. On the economic front positive reports edged out negatives 5 : 4. On the downtick: the NAHB housing index, housing starts, new home sales and the FHFA housing price index. On the uptick: building permits, existing homes sales, leading indicators, the WLEI and weekly jobless claims declined. While our leading indicators suggest housing has entered a new bull market, trailing indicators are still lagging.
LONG TERM: bull market
Our long term indicators continue to suggest equities are, and have been in since 2009, a bull market. We are expecting this bull market to end in the first half of 2013. Between now and then there are still many waves that need to unfold to complete this five Primary wave bull market. Which will end Cycle wave [1] of SC3. After it concludes the market should lose about 50% of its value between 2014 and 2016 during Cycle wave [2]. Also during this period the Secular bear cycle, from the year 2000, will end.
Over the next year the expected Black Swan, energy prices, will gradually fuel inflation. This will likely impact the emerging economies first, and then dampen growth in the developed economies. This will also put a halt to central bank liquidity programs. Which have assisted the economy and the equity bull market since 2009. And, were used to override the deflationary pressures of this Secular bear cycle. Many of the markets: stocks, commodities, currencies and then bonds, will go through major transitional changes starting in 2013 into 2016. Commodities should peak in 2014, and then enter a 21 year bear market. Bonds should peak in 2015, and then a 34 year bear market. The soon to emerge USD bull market should peak in 2019, and then enter a 10 year bear market. Stocks, as noted earlier, should bottom in 2016, and then start an exponential rise lasting for about two decades. Lots of changes ahead starting in 2013. Stay tuned.

For now, we’ll just track the significant waves of this bull market. Primary waves I and II completed in 2011 at SPX 1371 and 1075 respectively. Primary wave III has been underway since that low. Major waves 1 and 2, of Primary III, completed at SPX 1293 and 1159 respectively. Major wave 3 has been underway since that low. When Major wave 3 ends, we’ll still have Major waves 4 and 5 to complete Primary III. Then Primary waves IV and V to complete the bull market.
MEDIUM TERM: uptrend high at SPX 1414
The week started off by breaking through the SPX 1407 fibonacci resistance level. The breakthrough, however, was momentary as the market then pulled back for the rest of the week. Oddly enough, the SPX 1407 level acted like an OEW pivot, as the market hit the max range at 1414 and then rolled over. OEW pivots have a 7 point range.
During the rally from SPX 1340, Intermediate wave iv, the market had two minor pullbacks of 8 and 9 points respectively. That was it during the entire 74 point, 5.5%, advance. The pullback that followed was a bit more than expected. Typically the minor pullbacks have ranged between 11 and 20 points. This one was a bit larger nearly falling into the more significant pullback range of 33 to 65 points. Nevertheless, for now, the OEW 1386 pivot provided support, after a 27 point pullback, and the market equalled its best rally of the week heading into friday’s close.
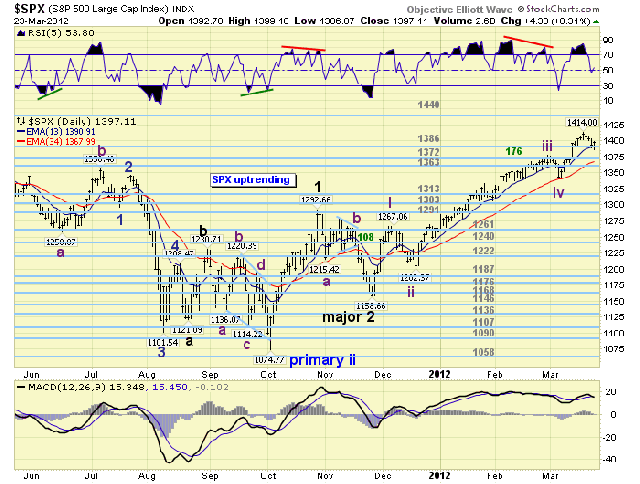
This uptrend is being counted as Major wave 3. Within Major 3 we have had five Intermediate waves: wave 1 SPX 1267, wave 2 SPX 1202, wave 3 SPX 1378, wave 4 SPX 1340, and wave 5 underway now. We also counted both Int. wave i and Int. wave iii with five Minor waves. This is displayed on the SPXhourly chart below. Int. wave v should also consist of five Minor waves. We’re counting the rally from SPX 1340-1414 as Minor wave 1 of Intermediate wave five. Then this pullback as Minor wave 2. We posted a tentative green label at SPX 1387. When this uptrend makes new highs we’ll upgrade it to the Minor wave 2 dark blue.
Looking ahead. We’re still expecting this uptrend to last until May. The first major resistance encountered should be at the OEW 1440 pivot, and SPX 1448. Then the next resistance level is at the OEW 1499 pivot, and SPX 1516. It is possible this uptrend, Major 3, could hit the OEW 1499 pivot before it ends. We’ll continue to track this uptrend, and then determine how that works out.
SHORT TERM
Short term support remains at the 1386 and 1372 pivots, with resistance at SPX 1408 and then 1414. Short term momentum is rising off a positive divergence. And, the short term OEW charts are on a positive bias.
The recent rally from SPX 1340 to 1414 only had two small pullbacks along the way. This is similar to the rally in the early part of February, which also lasted about two weeks. In february, after about one week of choppy activity the market started making new uptrend highs. We’ll see how this comparison works out.
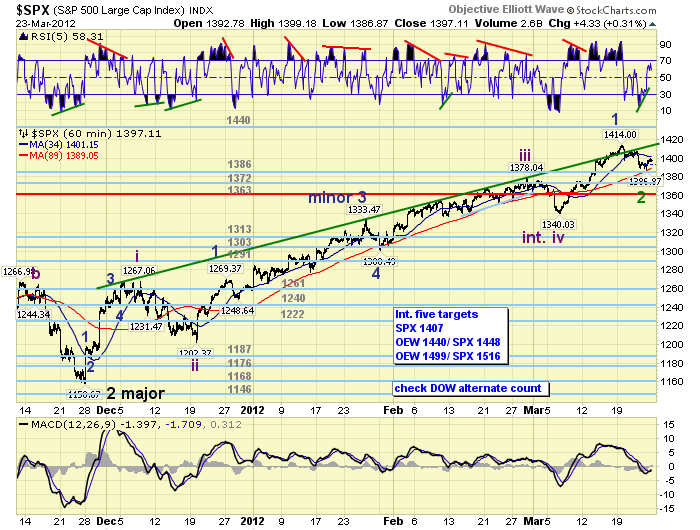
The recent rally halted right around the fibonacci resistance level of SPX 1407. This level placed Int. wave v at a 0.618 relationship to Int. wave i. Since this fibonacci relationship worked out quite well we again note the two others. First, Int. v = Int. i and 0.618 Int. iii @ SPX 1448. Second, Int. v = Int. iii and 1.618 Int. i @ SPX 1516. This is how we determined the levels of fibonacci resistance for Int. wave v. Near the beginning of Int. v we had posted the following resistance levels: SPX 1407, then the OEW 1440 pivot and SPX 1448, then the OEW 1499 pivot and SPX 1516. The OEW 1440 pivot is next. Best to your trading!
FOREIGN MARKETS
The Asian markets were mostly lower on the week for a net loss of 1.0%. Both Australia and India remain in confirmed downtrends.
The European markets were all lower on the week for a net loss of 2.6%. Only Spain’s IBEX is in a confirmed downtrend.
The Commodity equity group were all lower on the week for a net loss of 2.4%. Only Canada’s TSX remains in a confirmed downtrend.
The DJ World index is still uptrending but lost 1.1% on the week.
COMMODITIES
Bonds sold off early in the week but then recovered for a net gain of 0.2%. 10yr yields hit 2.4%, their highest level since October. Bond prices remain in a downtrend.
Crude had its usual volatile week ending with a net loss of 0.3%. It remains in an uptrend.
Gold was under pressure during the week, making a new downtrend low, but recovered on friday to end flat for the week.
The USD was also under some pressure for most of the week losing 0.6%. It is still in an uptrend. The downtrending EUR gained 0.7%, and the downtrending JPY had it best week in quite some time gaining 1.2%.
NEXT WEEK
Lots of important economic data. Monday kicks it off with Pending home sales at 10:00. On tuesday, Case-Shiller and Consumer confidence. Then on wednesday, Durable goods orders. On thursday, weekly Jobless claims and the third estimate for Q3 GDP. The market is looking for 3.0%. On friday, Personal income/spending, PCE prices, the Chicago PMI and Consumer sentiment. Should be interesting. As for the FED, they have a busy week. On monday at 8:00 FED chairman Bernanke gives a speech on the labor market. On tuesday Director Kamin testifies before congress on monetary policy and technology; FED chairman Bernanke continues with his lecture on the financial crisis, part 3; and FED governor Duke gives a speech on sustaining communities. On thursday, FED director Braunstein testifies before the senate on banking, housing and community affairs; then FED chairman Bernanke concludes his lecture with part 4 on the financial crisis. Best to your weekend and week.
CHARTS: http://stockcharts.com/...
http://caldaroew.spaces.live.com
After about 40 years of investing in the markets one learns that the markets are constantly changing, not only in price, but in what drives the markets. In the 1960s, the Nifty Fifty were the leaders of the stock market. In the 1970s, stock selection using Technical Analysis was important, as the market stayed with a trading range for the entire decade. In the 1980s, the market finally broke out of it doldrums, as the DOW broke through 1100 in 1982, and launched the greatest bull market on record.
Sharing is an important aspect of a life. Over 100 people have joined our group, from all walks of life, covering twenty three countries across the globe. It's been the most fun I have ever had in the market. Sharing uncommon knowledge, with investors. In hope of aiding them in finding their financial independence.
Copyright © 2012 Tony Caldaro - All Rights Reserved Disclaimer: The above is a matter of opinion provided for general information purposes only and is not intended as investment advice. Information and analysis above are derived from sources and utilising methods believed to be reliable, but we cannot accept responsibility for any losses you may incur as a result of this analysis. Individuals should consult with their personal financial advisors.
© 2005-2022 http://www.MarketOracle.co.uk - The Market Oracle is a FREE Daily Financial Markets Analysis & Forecasting online publication.