


US Stock Market Downtrend Appears Underway
Stock-Markets / US Stock Markets Apr 07, 2012 - 01:39 PM GMTBy: Tony_Caldaro

 After making a new uptrend high on monday US markets then began to weaken throughout the holiday shortened week. The SPX/DOW were -0.95% and the NDX/NAZ were mixed. Asian markets were quite mixed again -0.2%, but European markets were all lower for the third week in a row -2.9%. On the economic front positive reports outnumbered negative reports 8 to 6. On the uptick: ISM manufacturing, factory orders, auto sales, the M1-multiplier, investor sentiment, the WLEI, plus both weekly jobless and the unemployment rate improved. On the downtick: construction spending, ADP, ISM services, monthly payrolls, consumer credit and the monetary base. Next week we’ll get reports on the CPI/PPI, Export/Import prices, the twin deficits and the FED’s beige book.
LONG TERM: bull market
We continue to count this bull market as a five Primary wave Cycle wave [1] kickoff to a multi-generational Supercycle wave 3. We’re expecting this Cycle wave [1] bull market to take about four years to unfold, topping in 2013. The market has been in Primary wave III ever since the Primary wave II low in October 2011 at SPX 1075. Primary wave I had ended in May 2011 at SPX 1371, after rising from the bear market low in March 2009 at SPX 667.
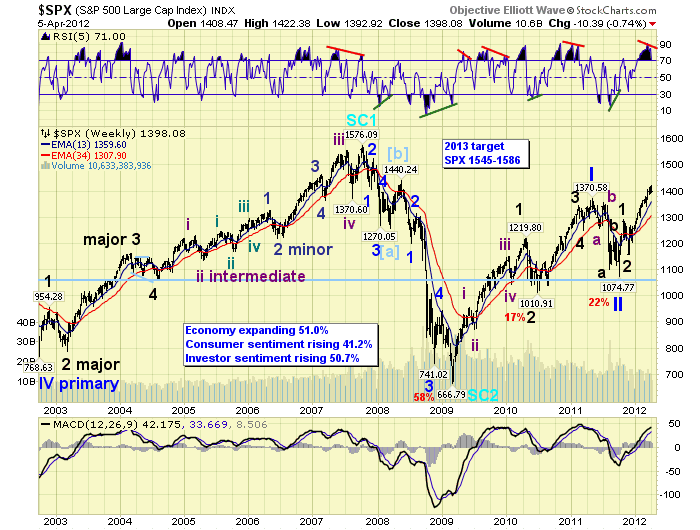
Primary wave III is clearly dividing into five Major waves. Major wave 1 concluded in October 2011 at SPX 1293, and Major wave 2 ended in November 2011 at SPX 1159. Major wave 3 has been underway since that low. The weekly charts have been displaying an extremely overbought RSI and MACD. These indicators only reach these types of levels during bull markets. In bear markets weekly RSI rarely gets overbought, and usually spends most of its time in oversold territory. While the MACD stays below neutral and is usually oversold as well. Since the RSI and MACD are still rising, and market breadth is making new highs, there are no signs of an impending bull market top any time soon.
MEDIUM TERM: uptrend may have topped at SPX 1422
As noted in last weekend’s update, foreign markets continued to deteriorate while the US market continued to rise. In February we also had this type of activity. But the four major US indices were quite strong then and pulled the rest of the world up with it. This time around the DOW was displaying weakness, and the NDX was losing upside momentum. After a five month uptrend, and a new uptrend high on monday, the US indices also started to weaken.
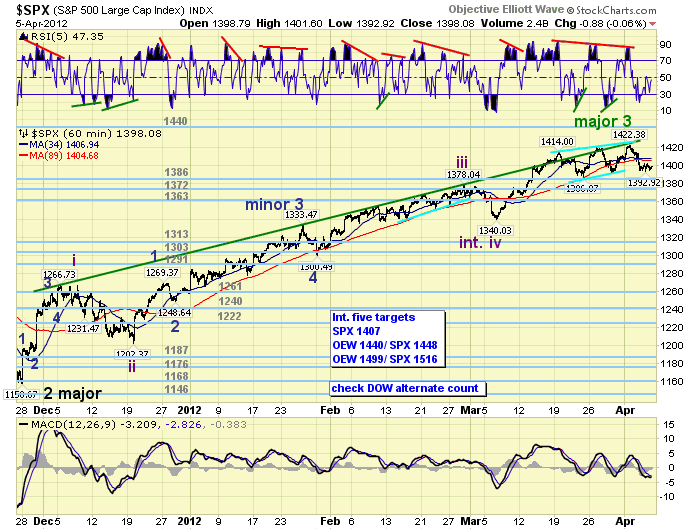
We have been counting this uptrend from SPX 1159 as Major wave 3 with five subdivisions: Int. wave i SPX 1267, Int. ii SPX 1202, Int. iii SPX 1378, Int. iv SPX 1340, and Int. wave v underway. Since fifth waves end uptrends we have been carefully tracking this one as it unfolded. The initial rally from the SPX 1340 Int. wave iv low was quite impressive. The market rose to SPX 1414, 5.5%, in just two weeks. This suggested the uptrend could extend into May, and hit either the OEW 1440 or 1499 pivots.
After a significant, and expected, pullback to SPX 1387 the market started to rally again. This time, however, the rally ended only five points higher, at SPX 1419. Then the market had another significant, this time unexpected, pullback to SPX 1392. In monday’s update, with the weakness in the foreign market increasing, we were prompted to detail a potential uptrend ending diagonal triangle being formed for Intermediate wave five. The wave action since the SPX 1414 high was unfolding in a symmetrical rising wedge shaped formation: 1414-1387-1419-1392-1422. In addition, there were negative RSI divergences on every timeframe up to, and including, the weekly charts.
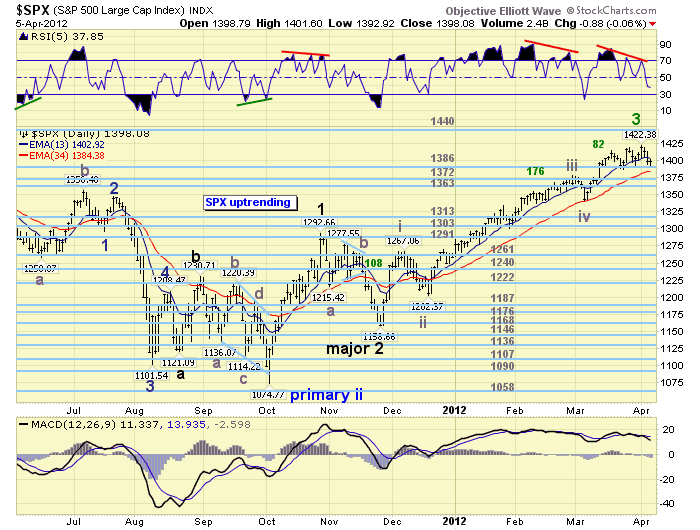
If this uptrend has indeed ended we can roughly estimate downtrending Major wave 4 support between SPX 1300 and 1340. Normal corrections during this bull market have ranged between 87 and 134 SPX points, with the mean between 95 and 105 points. This suggests support between SPX 1317 and 1327. Declines have also ranged between 7.1% and 10.4%, with the mean at 9.1%. This suggests a decline to SPX 1293. Fibonacci ratios suggest retracements to: 23.6% @ SPX 1360, 38.2% @ SPX 1322 and 50.0% @ SPX 1291. Finally the OEW pivots are at 1363, 1313, 1303 and 1291. In summary we appear to have a cluster of support levels between the OEW 1313 pivot and SPX 1327. This represents about a 100 SPX point correction, which is what we have been generally expecting once the uptrend ended. Timing cycles would suggest Major wave 4 should end in May.
SHORT TERM
Short term support is at the 1386, 1372 and 1363 pivot ranges, with overhead resistance at the SPX 1414, 1419 and 1422 levels. Short term momentum was quite oversold mid-week, then ended the week near neutral. This is normal for the beginning of a downtrend. The short term OEW charts remain with a negative bias under SPX 1404.
The market declined a bit on tuesday, hitting SPX 1405 intraday, and closed at 1413. Yet, when the SPX broke below 1404 on wednesday we posted a tentative ‘green’ Major wave 3 label at the SPX 1422 high. The market then traded down to SPX 1393 on thursday, creating the largest pullback since Int. wave iv. On friday, while the markets were closed, the ES futures dropped 15 points on a disappointing monthly payrolls report. Should the market open at that level on monday the SPX will have the biggest pullback since Int. wave ii. Currently it certainly looks like this uptrend ended at SPX 1422, after a five month 22.7% gain. Only an advance to new uptrend highs would change this opinion at this time. Best to your trading!
FOREIGN MARKETS
The Asian markets were quite mixed on the week for a net loss of 0.2%. China, Hong Kong and India are in confirmed downtrends.
The European markets were all lower on the week for a net loss of 2.9%. England, France, Italy, Spain and the STOX 50 are all in confirmed downtrends.
The Commodity equity markets were mostly lower for a net loss of 1.1%. They have also been lower for three weeks in a row. All three indices: Brazil, Canada and Russia are in confirmed downtrends.
The DJ World index is still uptrending but lost 1.5% on the week. Total confirmed downtrends, worldwide, are now at their highest level since the US uptrend began in November.
COMMODITIES
Bonds had a wild week but gained 0.4% and are still in a downtrend.
Crude was also quite volatile but gained 0.2% and is still in a downtrend.
Gold came under selling pressure this week and made new downtrend lows, losing 2.3% for the week.
The USD resumed its uptrend gaining 1.4%, as the downtrending EUR lost 2.1%, and downtrending JPY gained 0.7%.
NEXT WEEK
Tuesday kicks off the economic week with Wholesale inventories. On wednesday, we have Export/Import prices, the Budget deficit and the FED’s beige book. On thursday, weekly Jobless claims, the PPI, and the Trade deficit. Then on friday, the CPI and Consumer sentiment. As for the FED. Monday night FED chairman Bernanke gives a speech on financial stability at the Atlanta FED. On wednesday night FED vice chair Yellen gives a speech on economic outlook and monetary policy at NYU. On thursday, FED governor Raskin gives a speech on the state of the economy at the San Francisco FED. Then on friday, FED chairman Bernanke gives a speech at the “rethinking finance” conference in NYC. This could be quite a wild week. Best to you and yours this holiday weekend.
CHARTS: http://stockcharts.com/...
http://caldaroew.spaces.live.com
After about 40 years of investing in the markets one learns that the markets are constantly changing, not only in price, but in what drives the markets. In the 1960s, the Nifty Fifty were the leaders of the stock market. In the 1970s, stock selection using Technical Analysis was important, as the market stayed with a trading range for the entire decade. In the 1980s, the market finally broke out of it doldrums, as the DOW broke through 1100 in 1982, and launched the greatest bull market on record.
Sharing is an important aspect of a life. Over 100 people have joined our group, from all walks of life, covering twenty three countries across the globe. It's been the most fun I have ever had in the market. Sharing uncommon knowledge, with investors. In hope of aiding them in finding their financial independence.
Copyright © 2012 Tony Caldaro - All Rights Reserved Disclaimer: The above is a matter of opinion provided for general information purposes only and is not intended as investment advice. Information and analysis above are derived from sources and utilising methods believed to be reliable, but we cannot accept responsibility for any losses you may incur as a result of this analysis. Individuals should consult with their personal financial advisors.
© 2005-2022 http://www.MarketOracle.co.uk - The Market Oracle is a FREE Daily Financial Markets Analysis & Forecasting online publication.