


Further Downside Run in Gold and Gold Stocks is Coming! Here's Why
Commodities / Gold & Silver Stocks Apr 09, 2012 - 06:18 AM GMTBy: Dr_Nu_Yu

 The Fed's recent inference that QE3 was not imminent has caused physical gold and silver and the HUI and XAU to breach their downside support lines. These transitions set up the distinct possibility that we could well see $1,500 gold and the HUI and XAU at 400 and 144, respectively! Let me outline my analyses of the current situation and how it might unfold.
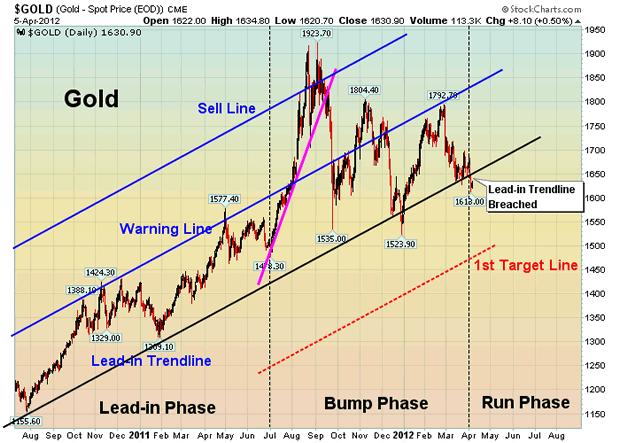
GOLD now in a downhill run
Gold had been in a 20-month long "Bump-and-Run Reversal Top" pattern but, with the recent events, has transitioned from the "Bump" phase to the "Run" phase. This should result in a downhill run in its price to the first support line at around $1,500/ozt.
According to Thomas Bulkowski, the Bump-and-Run Reversal Top pattern consists of three main phases:
- A lead-in phase in which a lead-in trend line connecting the lows has a slope angle of about 30 degrees. Prices move in an orderly manner and the range of price oscillation defines the lead-in height between the lead-in trend line and the warning line which is parallel to the lead-in trend line.
- A bump phase where, after prices cross above the warning line, excessive speculation kicks in and the bump phase starts with fast rising prices following a sharp trend line slope with 45 degrees or more until prices reach a bump height with at least twice the lead-in height. Once the second parallel line gets crossed over, it serves as a sell line.
- A run phase in which prices break support from the lead-in trend line in a downhill run.
Below is a chart showing how this trend should unfold:
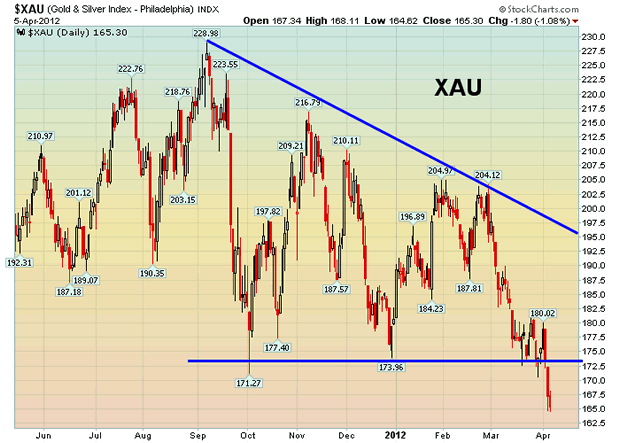
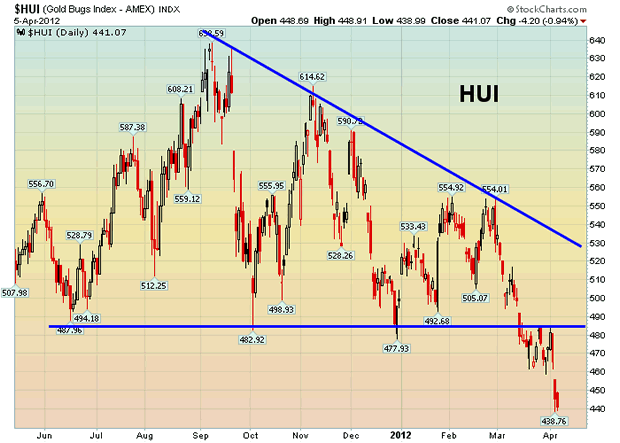
XAU & HUI have now broken to the downside
As the two charts below clearly show, both XAU and HUI have broken to the downside from their 7-month "Descending Triangle" patterns. The descending triangle is a bearish formation confined by an upper descending trend line and a lower horizontal line. Once a downside breakout occurs, a price target is projected by measuring the widest distance of the pattern, multiplying it by 54% price target meeting rate, and subtracting it from the breakout. Therefore, XAU could fall to 144 and HUI could fall to 400. Both should decline about 17% measured from the breakout.
For my analysis of what is unfolding for silver, the U.S. Dollar Index and 30-year Treasury Bonds please go here or read a version of it on the site of my editor, Lorimer Wilson, here.
Dr. Nu Yu (fx5186.wordpress.com/), co-founder and president of Numarkan Investments and an affiliate of the Market Technician Association, is a frequent contributor to www.munKNEE.com
Visit http://www.FinancialArticleSummariesToday.com, “A site/sight for sore eyes and inquisitive minds”, and www.munKNEE.com, “It’s all about MONEY”, where you can sign up for their FREE weekly "Top 100 Stock Market, Asset Ratio & Economic Indicators in Review."
© 2012 Copyright Dr. Nu Yu - All Rights Reserved
Disclaimer: The above is a matter of opinion provided for general information purposes only and is not intended as investment advice. Information and analysis above are derived from sources and utilising methods believed to be reliable, but we cannot accept responsibility for any losses you may incur as a result of this analysis. Individuals should consult with their personal financial advisors.
© 2005-2022 http://www.MarketOracle.co.uk - The Market Oracle is a FREE Daily Financial Markets Analysis & Forecasting online publication.