


What Institutional Investors Are Doing May Surprise You ...
Stock-Markets / Stock Markets 2012 Apr 12, 2012 - 05:41 AM GMTBy: Marty_Chenard

When you look at an old fashion pendulum clock you know that it swings from one extreme to the next. Each time it reaches an extreme it moves back down to normality (the bottom center of the swing) and then overshoots it until the next extreme.
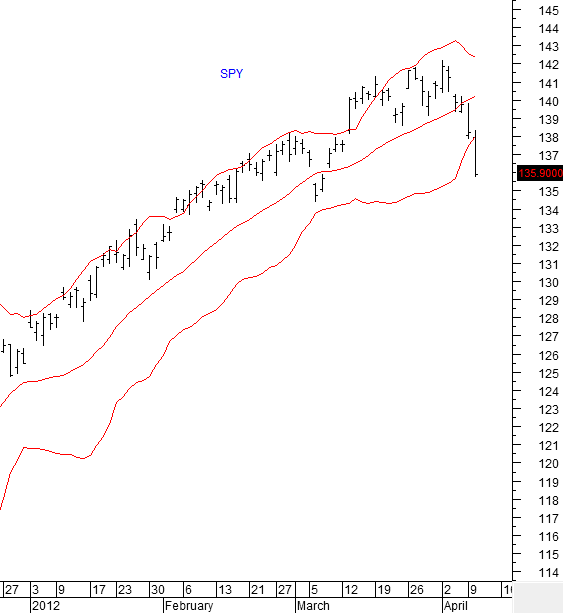
The pendulum extremes are like being above or below the upper and lower Bollinger Band levels. The Center line in middle of a Bollinger Band is like the normality level over time.
So, like a pendulum extreme, when a tick falls well below a lower Bollinger Band like yesterday, it is an extreme level where it comes under pressure to move back into the Bollinger Band area. Sometimes, it takes a couple of ticks below the lower Bollinger Band to find its true extreme level, but the fear index (the VIX) often gives you a clue about when the extreme has been reached.
In any case, this morning's gap up opening was a normal reaction to an overextended tick on the lower Bollinger Band. At 10:07, the $NYBR (New York Stock Exchange Breadth) was at 2131 ... a strong positive level. If it falls below 700 today, it could get into trouble ... but for now, it is nice and strong.
By Marty Chenard
http://www.stocktiming.com/
Please Note: We do not issue Buy or Sell timing recommendations on these Free daily update pages . I hope you understand, that in fairness, our Buy/Sell recommendations and advanced market Models are only available to our paid subscribers on a password required basis. Membership information
Marty Chenard is the Author and Teacher of two Seminar Courses on "Advanced Technical Analysis Investing", Mr. Chenard has been investing for over 30 years. In 2001 when the NASDAQ dropped 24.5%, his personal investment performance for the year was a gain of 57.428%. He is an Advanced Stock Market Technical Analyst that has developed his own proprietary analytical tools. As a result, he was out of the market two weeks before the 1987 Crash in the most recent Bear Market he faxed his Members in March 2000 telling them all to SELL. He is an advanced technical analyst and not an investment advisor, nor a securities broker.
Marty Chenard Archive |
© 2005-2022 http://www.MarketOracle.co.uk - The Market Oracle is a FREE Daily Financial Markets Analysis & Forecasting online publication.