Gold and HUI Divergences? or Telling the Real Story
Commodities / Gold and Silver 2012 Apr 15, 2012 - 08:27 AM GMT Whilst the US markets continue to whipsaw around, I have been turning my attentions to finding other ideas for solid setups, trades that we can limit small risk and find potentially profitable trades.
As the US markets continue to play havoc with traders, we have been turning more and more to cleaner much more safer markets, such as the FX markets as well as the precious metals.
HUI
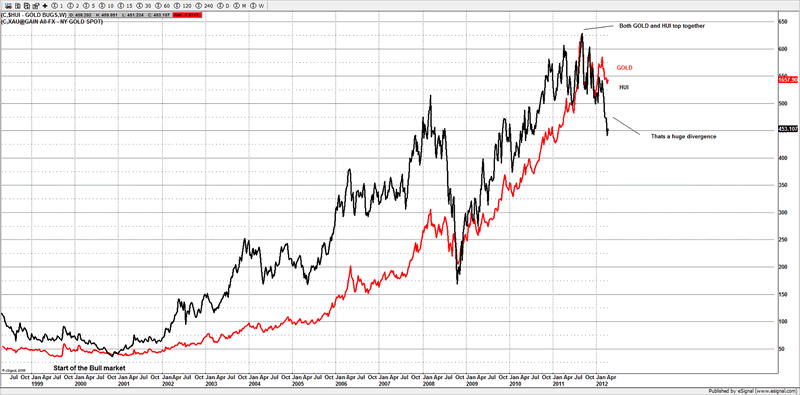
Originally I was using this chart to find a high in gold way back in September 2011, it was one of the reasons I was very vocal about the gold rally as I was tracking a pattern from the 2000 lows in the HUI, and called a top near $1845.
As you can see they pretty much have followed each other for the past 10 yrs or so.
Look in the insert, you can see how this hit the measured target and reversed hard, its fell a considerable way from the bullish heights, when traders loved gold and gold stocks.
Looking back it's so easy to say well it was a blow off move in gold, yet saying that it was one, is a little different to actually having faith that it was a blow off. It's tough going against the herd at times, especially when the herd is so one sided, being bearish on gold and gold stocks in September 2011, felt like I was a criminal, although I seldom let public opinion matter, as with my work I trust it 100%, I stuck to my analysis and it paid off.
The insert clearly shows the rejection on the HUI, at exactly the point gold topped.
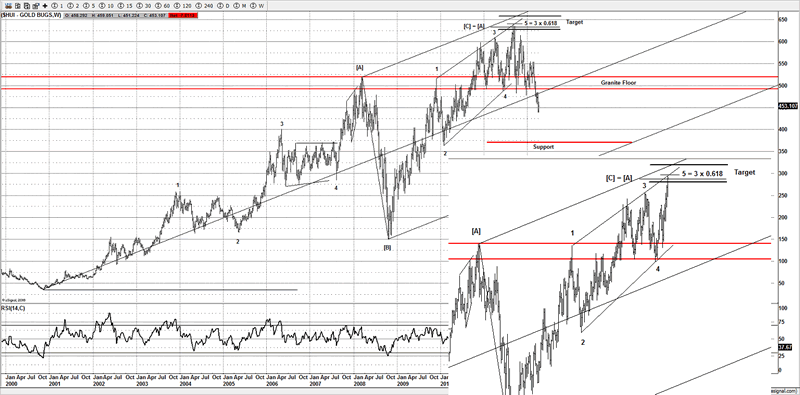
Look carefully you will note the obvious H&S that most technicians have already made known in public, however, that don't concern me too much, what is a problem for me to be bullish on gold stocks, is the fact that the "granite floor" has gave out and its failed to get above.
That is not an encouraging sign; its feeble attempt so far, is a problem for the bulls.
The divergence between the HUI and gold is alarming, and I suspect there is a great arbitrage setting up.
is about to see a sustainable move lower and break $1600, or the HUI I suspect is setting up to break above the "granite floor".
Both markets require careful monitoring.
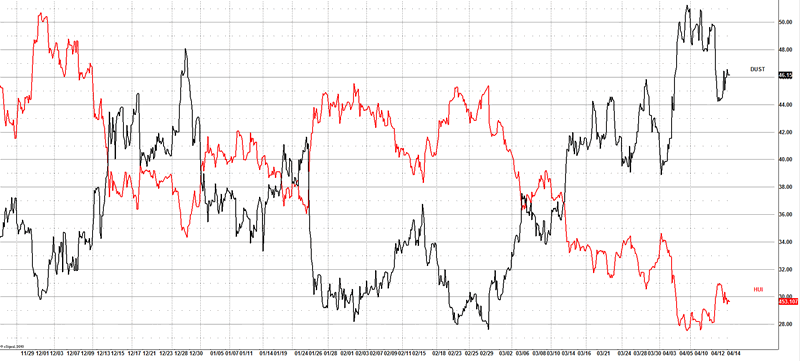
One way to take advantage of a decline in the HUI is through DUST.
You simply buy DUST if you see a rejection in the HUI at resistance, whilst the HUI is below the red lined area, the tape is a bearish looking tape, bulls need to find their "mojo" soon or I see a trip to the initial support zone around 375 on the horizon over the coming weeks.
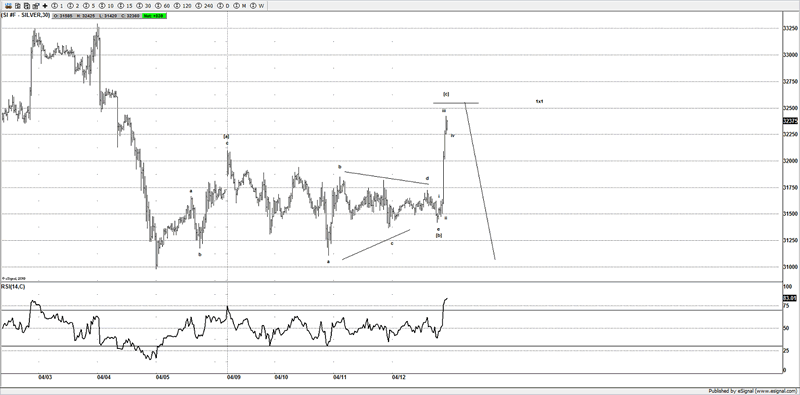
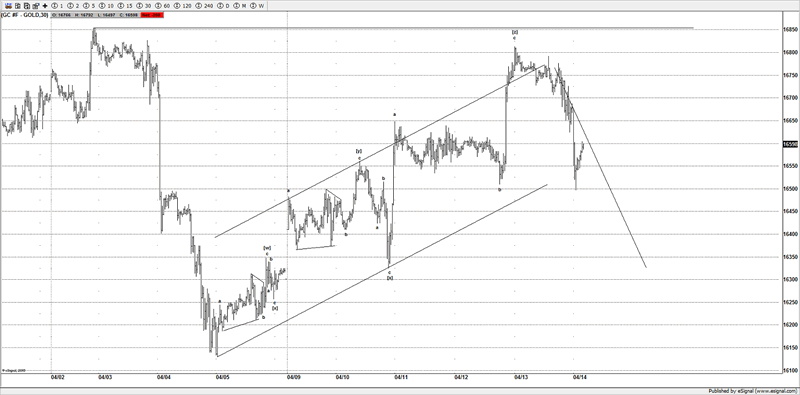
The recent bounces in gold and silver have been weak and I suspect a failed attempt would be seen, well Friday saw a reversal from targets areas well before they broke lower, and in fact yielded a nice trade in silver. Gold followed as well although it was not as aggressive as silver. Those were very simple trades that were nailed to the tick and rejected from our measured move targets.
Before
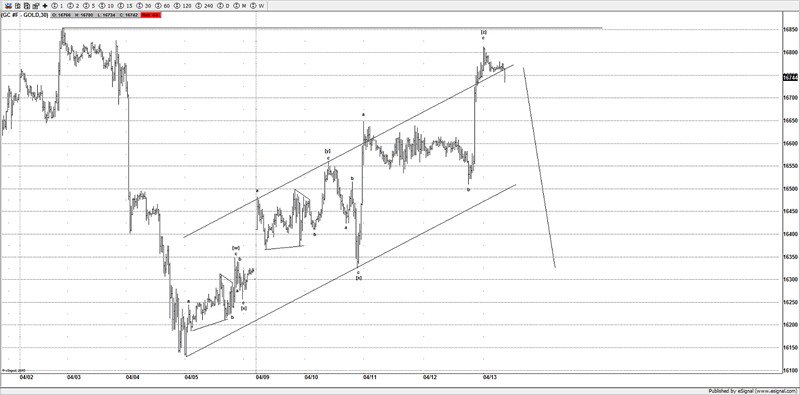
Until gold gets above $1680 the bulls have to deal with that resistance area and the trend short term is down from the Feb 2012 highs.
After
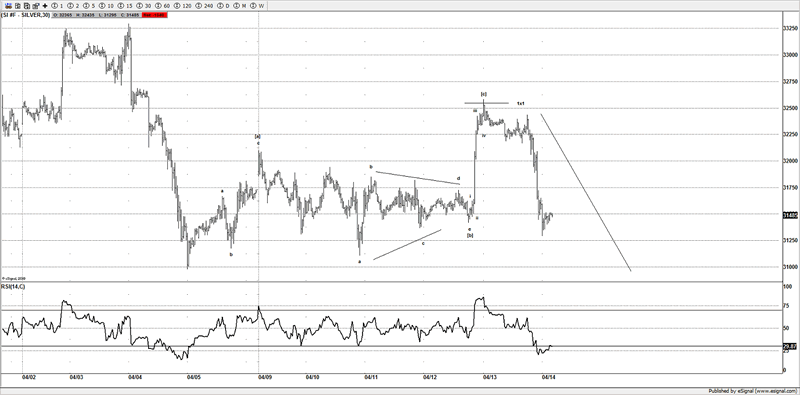
We are working some ideas that still potentially require a little bit lower, in order to help confirm if the suspected correction is nearly over from the Feb 2012 highs.
Traders were very bullish at those highs whilst we were getting out of longs and looking to sell the move lower, I see some bearish signs still around, it's almost like traders don't trust the moves.
Now I won't sit here and write that it's incredibly bullish that most traders appear to be bearish on silver and gold atm, it's natural for traders to feel the worst and bearish at the lows.
But we are tracking some ideas and if they come off, if could surprise many traders.
Although every trade comes with risk, but I am sure that as long as we control risk we can find a way to profit whichever way it decides to move.
If you're interested in following the ideas in gold, silver and HUI, both long term and short term, then I encourage you to either sign up to one of two packages that we have to offer. It's probably the best $15-$20 you will ever spend on market analysis, but then I am biased, don't take my word for it, test drive the service.
Until next time.
Have a profitable week ahead.
Click here to become a member
You can also follow us on twitter
What do we offer?
Short and long term analysis on US and European markets, various major FX pairs, commodities from Gold and silver to markets like natural gas.
Daily analysis on where I think the market is going with key support and resistance areas, we move and adjust as the market adjusts.
A chat room where members can discuss ideas with me or other members.
Members get to know who is moving the markets in the S&P pits*
*I have permission to post comments from the audio I hear from the S&P pits.
If you looking for quality analysis from someone that actually looks at multiple charts and works hard at providing members information to stay on the right side of the trends and making $$$, why not give the site a trial.
If any of the readers want to see this article in a PDF format.
Please send an e-mail to Enquires@wavepatterntraders.com
Please put in the header PDF, or make it known that you want to be added to the mailing list for any future articles.
Or if you have any questions about becoming a member, please use the email address above.
If you like what you see, or want to see more of my work, then please sign up for the 4 week trial.
This article is just a small portion of the markets I follow.
I cover many markets, from FX to US equities, right the way through to commodities.
If I have the data I am more than willing to offer requests to members.
Currently new members can sign up for a 4 week free trial to test drive the site, and see if my work can help in your trading and if it meets your requirements.
If you don't like what you see, then drop me an email within the 1st 4 weeks from when you join, and ask for a no questions refund.
You simply have nothing to lose.
By Jason Soni AKA Nouf
© 2012 Copyright Jason Soni AKA Nouf - All Rights Reserved
Disclaimer: The above is a matter of opinion provided for general information purposes only and is not intended as investment advice. Information and analysis above are derived from sources and utilising methods believed to be reliable, but we cannot accept responsibility for any losses you may incur as a result of this analysis. Individuals should consult with their personal financial advisors.
© 2005-2022 http://www.MarketOracle.co.uk - The Market Oracle is a FREE Daily Financial Markets Analysis & Forecasting online publication.


