


Uranium Stocks Bearish Chart Signals
Commodities / Uranium Jan 18, 2008 - 10:51 AM GMTBy: Merv_Burak
 Boy, there are going to be some good bargains after all this is over, but it's not all over yet. Another bad day at the markets. The Merv's Daily Uranium Index closed lower by 0.158 points or 4.17%. It just feels like things are getting worse every day. There were only 3 stocks that closed higher today while 44 (out of 50) closed lower. There were 3 unchanged. As for the biggies, they all have seen better days. Cameco lost 4.2%, Denison lost 4.0%, Paladin lost 6.2%, UEX lost 4.7% and Uranium One lost 4.0%. The best performer of those three winners was Western Uranium with a 9.4% gain (not bad for a crummy day) while the worst performer was Alberta Star with a loss of 14.7%.
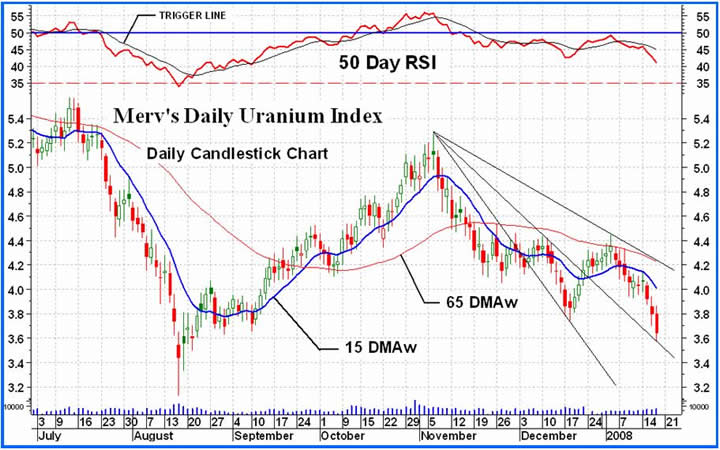
The Index moved decisively below its mid-December low thereby nullifying the potential reverse head and shoulder pattern that was in development. Now all we have left is the FAN trend lines. The day's action just touched the second FAN trend line, which I had mentioned was a support line. The Index should stay inside the space between the second and third FAN trend lines or else things are worse than I think they are. As for the normal chart and indicators, nothing has changed from yesterday. Therefore BEARISH is the only rating I can give the intermediate term.
Well, the aggressive Stochastic Oscillator has now moved into its oversold zone, which for this indicator is the 20% line. The short term momentum indicator has also moved into its oversold zone, which for this indicator is the 30% line. We can now look forward to some stabilizing of the Index action and maybe some preparation for a reversal. Reversals very often start from these levels. The only problem is that the indicator can stay inside its oversold zone for some time while moving lower. What we now need is to see the indicators firm up and reverse. However, for now nothing has changed from yesterday and the short term rating stays as a BEARISH rating.
Now you see why I have been cautioning investors and speculators about risking their capital. Wait for the trend to reverse and then get back in with lower risk and maybe lower prices, but at least lower risk.
By Merv Burak, CMT
Hudson Aero/Systems Inc.
Technical Information Group
for Technically Uranium with Merv
Web: http://techuranium.blogspot.com/
e-mail: merv@themarkettraders.com
During the day Merv practices his engineering profession as a Consulting Aerospace Engineer. Once the sun goes down and night descends upon the earth Merv dons his other hat as a Chartered Market Technician ( CMT ) and tries to decipher what's going on in the securities markets. As an underground surveyor in the gold mines of Canada 's Northwest Territories in his youth, Merv has a soft spot for the gold industry and has developed several Gold Indices reflecting different aspects of the industry. As a basically lazy individual Merv's driving focus is to KEEP IT SIMPLE .
This Blog is - A periodic review of the daily or weekly market action in uranium stocks. The review is strictly from the technical perspective. Merv is a pure market technician. Weekly, one will find a table of technical information and ratings of the 50 component stocks of the Merv's Uranium Index as well as a weekly summary of the uranium stock activity. Daily (most days), one will find a daily review of the market action of the Merv's Daily Uranium Index as well as technical analysis of one or more uranium stocks of interest.
Disclaimer - Technical analysis is not perfect. Should you expect perfection this is not the site for you.
Technical analysis IS a very sound technique to assess the daily or weekly trading activities in securities and to assess appropriate timing of investment activities. This blog provides such technical analysis of the trading activity in uranium stocks for your information. Any use made of this information is strictly at the users risk. No guarantees are made for the accuracy or potential for the information provided herein. Use at your own risk. You are strongly advised to check with your broker or investment adviser before activating any investment desisions.
Merv Burak Archive |
© 2005-2022 http://www.MarketOracle.co.uk - The Market Oracle is a FREE Daily Financial Markets Analysis & Forecasting online publication.