


Gold Stocks Continue to Underperform Gold Bullion
Commodities / Gold and Silver 2012 Apr 23, 2012 - 03:09 AM GMTBy: Willem_Weytjens

 I have written (and warned my readers) several times about the weak performance of the HUI index compared to the price of Gold.
Despite general stock markets approaching pre-crisis highs and Gold holding up quite well so far, the HUI index has dropped quite substantially. The combination of weak performance of HUI stocks and the relatively “strong” action of Gold, caused the HUI index to underperform Gold dramatically.
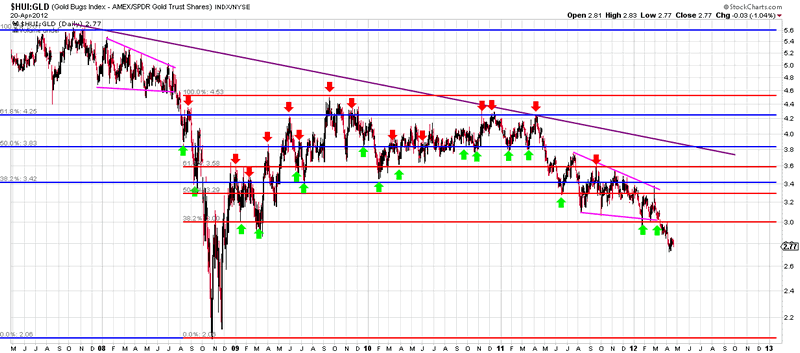
Chart courtesy stockcharts.com
I have often compared the underperformance of the HUI index relative to Gold to the situation in 2008, right before the “big crash”.
Here it is once again:
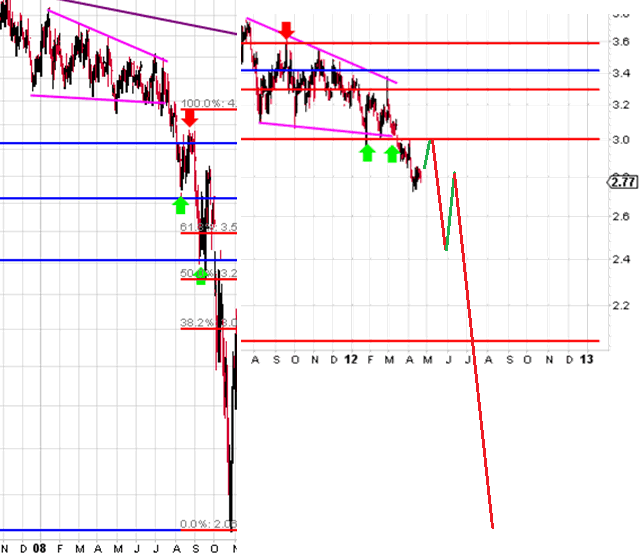
Chart courtesy stockcharts.com
Now let’s suppose the pattern above takes place. How could we get there?
1) a severe market crash, just like in 2008;
2) a big drop in Gold prices, which would most likely lead to an even bigger decline in Gold stocks; OR
3) a HUGE rally in Gold prices.
How could that be? Well, in the late 1970′s, Gold rallied substantially, causing everybody to believe that those high Gold prices (and therefore mining companies’ margins) were not sustainable. They bought Gold bullion while they ignored the mining stocks.
Once it appeared clear that the high Gold prices WERE in fact sustainable, the Gold Stocks rallied. They even rallied to new highs AFTER the Gold price peaked in early 1980!
We might be in a similar situation today. Nobody wants the mining stocks. If Gold would rally to new highs, it could be on its way to $4,000-$5,000. Could it be that most people now think that those Gold Prices ($1,650 per ounce) are not sustainable?
What if Gold suddenly rallies to $4,000? Then suddenly everybody will start to chase stocks of the Gold Miners.
On the other hand, here’s another interesting chart, showing the BGMI-to-Gold (BGMI = Barron’s Gold Mining Index) from 1967 to 1980 (blue line) and the HUI-to-Gold ratio from 1993 until today. If this pattern continues, it could mean that the underperformance of the Gold Stocks is about to end.
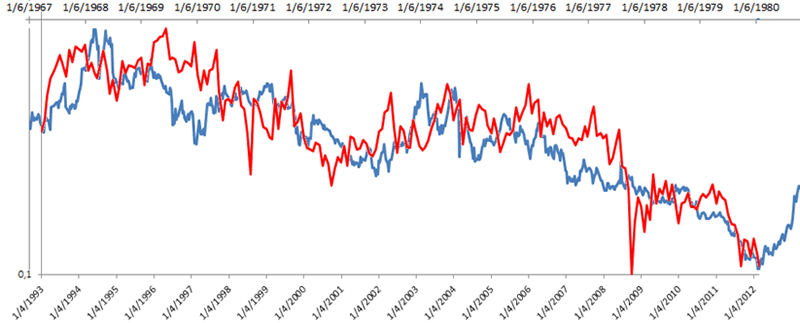
However, it could therefore also imply that the top for Gold is set.
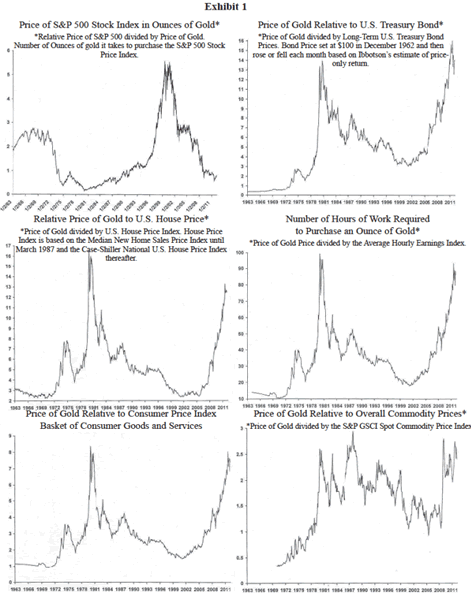
I definitely know that the Fundamentals for higher Gold Prices are there (think of all the money printing etc), but have a look at the following chart from James Paulsen, Chief Investment Strategist at Wells Capital Management (Wells Fargo) recently shared:
Gold does look expensive based on these charts, doesn’t it?
For more articles, trading Updates, Nightly Reports and much more, please visit www.profitimes.com and feel free to sign up for our services!
Willem Weytjens
www.profitimes.com
© 2012 Copyright Willem Weytjens - All Rights Reserved
Disclaimer: The above is a matter of opinion provided for general information purposes only and is not intended as investment advice. Information and analysis above are derived from sources and utilising methods believed to be reliable, but we cannot accept responsibility for any losses you may incur as a result of this analysis. Individuals should consult with their personal financial advisors.
© 2005-2022 http://www.MarketOracle.co.uk - The Market Oracle is a FREE Daily Financial Markets Analysis & Forecasting online publication.