


U.S. Consumers Still Key to Economic Outlook
Economics / US Economy May 01, 2012 - 06:05 AM GMTBy: John_Mauldin

 What I like most about Gary Shilling's economic analysis is that it's thorough.In the piece that follows – an excerpt from Gary's monthly INSIGHT – he ranges from the importance of US consumer spending and the unemployment rate, to the actions of the Fed, to business cost cutting and productivity, to the housing crisis and household debt, to state and local government fiscal issues, to US exports– Etc.! So by time he gets ready to deliver conclusions, you know they're well-supported. And Gary's overall conclusion here, regarding the rest of 2012, is a strong one and maybe not quite what you'd expect.
As part of the deal with Gary to send you his material, he has asked me to offer you the chance to subscribe to his letter. If you like his work as much as I do, I suggest you consider it. Outside the Box readers can subscribe to INSIGHT for the special rate of $275, and you'll receive 13 reports instead of the normal 12, plus a free 10-page Special Report outlining Gary Shilling's investment strategies for 2012. (This offer is available to NEW subscribers only.) To subscribe, call them at 1-888-346-7444 or 973-467-0070, and be sure to mention Outside the Box to receive your special rate and free report.
Your home at last but not for long analyst,
John Mauldin, Editor
Outside the Box
JohnMauldin@2000wave.com
U.S. Consumers: Still Key to the Outlook
(Excerpted from the April 2012 edition of A. Gary Shilling's INSIGHT)
In the Dec. 2011 issue of my Insight newsletter, I wrote: "In the U.S., major new fiscal stimulus is on hold, and monetary policy is impotent. State and local spending, housing, inventory investment, capital equipment investment and commercial construction are likely to remain subdued. U.S. exports are curtailed by sluggish foreign economies. So U.S. growth in 2012 will be decided by consumer spending, 71% of GDP. With declining real wages and incomes and low confidence, continuing strength in outlays is unlikely. A 2012 U.S. recession is probable, but milder than the 2007-2009 nosedive, unless another financial crisis unfolds."
Four Months Later
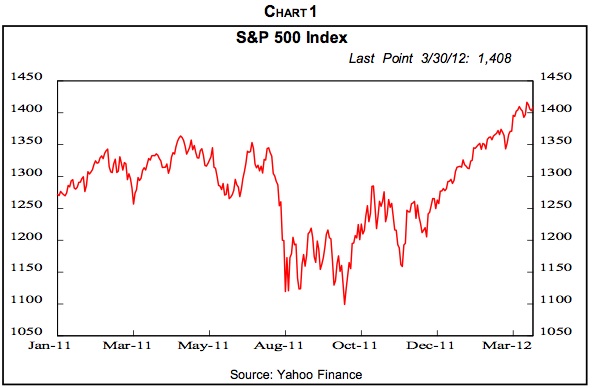
Well, here we are, four months later. Do the economy and financial markets in the ensuing times substantiate our forecast? The chorus of bullish investors bellows, "No!" as they point to the 29% rise in the S&P 500 index from its October 2011 low (Chart 1). They even believe that a continued sluggish economy is good news.
In his March 26 speech to business economists, Fed Chairman Bernanke concentrated on the still-weak unemployment scene and said that more declines in unemployment will need "more rapid expansion of production and demand from consumers and business, a process that can be supported by continued accommodative policies." He didn't say so, but his comments suggested that the economy might be weak enough in future quarters to precipitate another round of Quantitative Easing by Fed purchases of Treasurys and mortgage-backed securities.
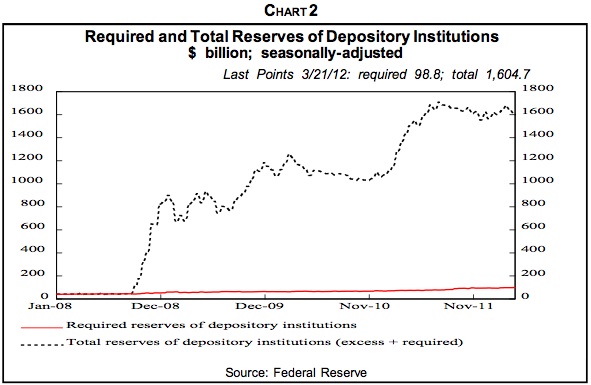
The stock market took off like a scalded dog right after his remarks. Apparently, investors believed that the negative effects a weak economy would have on corporate profits and dividends pale compared to the influence of the money received directly by sellers of securities to the Fed. They certainly can't expect any multiplier effect from the member banks' reserves created by the Fed in the process. Note (Chart 2) that QE1 and QE2 piled up those reserves, which now exceed reserve requirements by about $1.5 trillion. Banks refuse to lend to any but the most creditworthy, and they are loaded with cash and don't need to borrow much. Given the euphoria over stocks, they might also rally if the economy strengthens and eliminates the prospect for more quantitative easing. Can you have it both ways?
In any event, let's take a hard analytical look at recent data to test the validity of our earlier forecast of a weak U.S. economy and likely moderate recession this year. Payroll employment growth has risen in recent months, although unseasonably warm winter weather may have temporarily boosted jobs. Furthermore, employment growth has been from an extremely low recessionary base and the unemployment rate is still high.
The decline in initial claims for unemployment benefits reflects the decline in layoffs, but that's different from new hires, which have risen much more slowly than job openings. These trends for the total job market are also seen for small businesses, which account for about half of new jobs. Job openings rose 17% in February from a year earlier but small business plans to increase staff in the next three months were up only 4% from a year earlier. Furthermore, entrepreneurs aren't all that enthusiastic, with only 2.7% of job seekers starting new businesses in the last quarter, down from 12% in the third quarter of 2009.
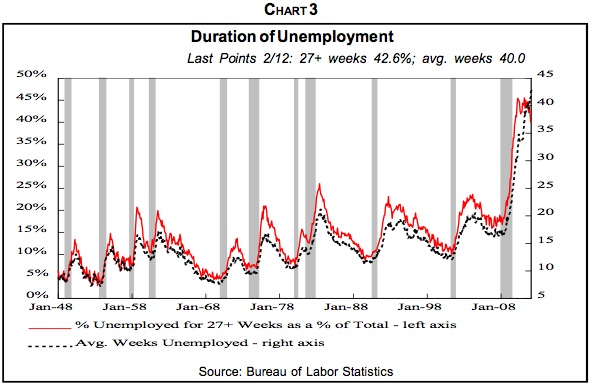
American business has lots of job openings, but having gone through massive layoffs in recent years, employers are being very picky in new hiring. Contrary to Chairman Bernanke's belief that high unemployment is mainly a cyclical problem that will be solved by economic growth, we believe a big part of it is structural. Employers may have jobs available for software engineers or skilled machinists, but unemployed residential construction carpenters probably don't have the necessary skills. Employment for college graduates is up 5.8% so far in the recovery but jobs held by high school dropouts, generally with low skills, are down 3.9%. And the skills of those out of work for extended periods, as is true of many today (Chart 3), tend to erode.
Furthermore, homeowners who are under water with their mortgages exceeding their houses' values can't easily sell their abodes to accept jobs in distant locations. And if both spouses work, one of them may be unwilling to accept a job in a faraway city for fear that the other can't get a job there too.
"A Puzzle"
Although still very high, the unemployment rate has declined sharply of late from 9.1% last August to 8.3% in January and February and 8.2% in March, despite the ongoing slow growth in the economy. Chairman Bernanke calls this contrast "something of a puzzle." It is something of an extreme but not wildly off the chart.
You may recall Chart 4, which I've used in past Insights and in my recent book, The Age of Deleveraging: Investment strategies for a decade of slow growth and deflation, to show that the relationship between the year-over-year change in real GDP and the year-over-year change in the unemployment rate over the post-World War II era indicated that it takes an average 3.3% real GDP growth to keep the unemployment rate stable.
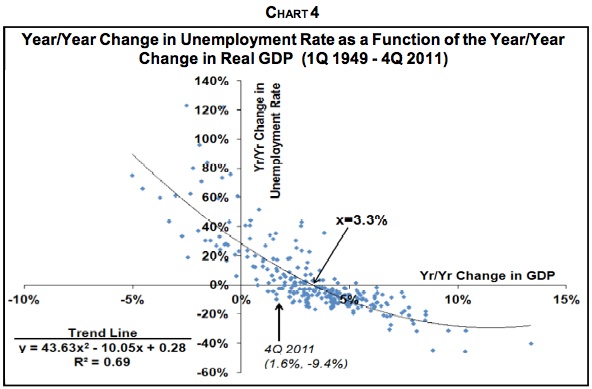
With my 2.0% annual growth forecast for the remaining five to seven years of deleveraging, the unemployment rate, reading off the curve in Chart 4, will rise a bit over one percentage point each year. From 8.3% in February 2012, it would jump to 9.3% in February 2013, to 10.4% in February 2014, etc. We went on to note that no U.S. government—left, right or center—could stand for high and chronically rising unemployment so there will be continuing pressure for job creation, and the resulting continuation of $1 trillion-plus federal deficits.
Nevertheless, from its peak of 10.0% in October 2009, the unemployment rate fell to 8.3% in both January and February while real GDP growth averaged only 2.4%. Reading off the curve, the unemployment rate would have gone the opposite way, jumping from 10.0% to 11.5%. The vast difference between an 11.5% unemployment rate and 8.3% doesn't invalidate the value of the curve shown in Chart 4. Note that a number of points in the scatter diagram are some distance off the fitted line. Furthermore, the point for the fourth quarter of 2011, when real GDP rose 1.6% from a year earlier and the unemployment rate fell to 9.4%, really isn't an outlier, as shown in the chart. Nevertheless, the curve indicated that a 1.6% rise in real GDP in the past year would have pushed the unemployment rate from 9.6% in the fourth quarter of 2010 to 10.9% a year later rather than the actual decline to 8.3%.
Business Cost-Cutting
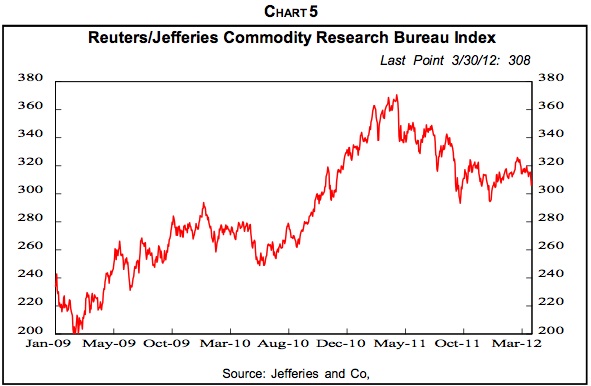
During this sluggish business recovery that began in mid-2009, sales volume increases for American business have been tiny and the ability to raise selling prices very limited while commodity and other input prices climbed until about a year ago (Chart 5). Meanwhile, foreign competition has been excruciating in a world of more-than ample supply. Small business optimism has recovered somewhat from its recessionary collapse, but the biggest concern of small business owners is not labor availability, access to loans, taxes, regulation or insurance—it's weak sales.
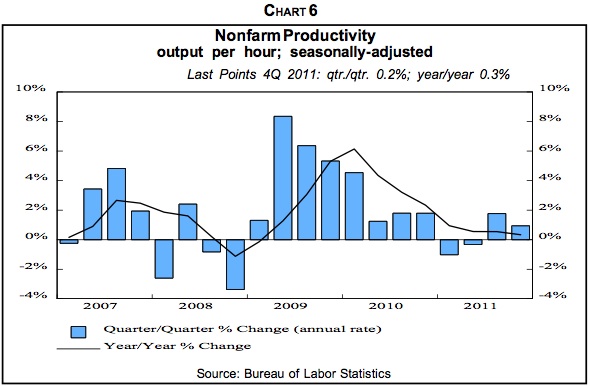
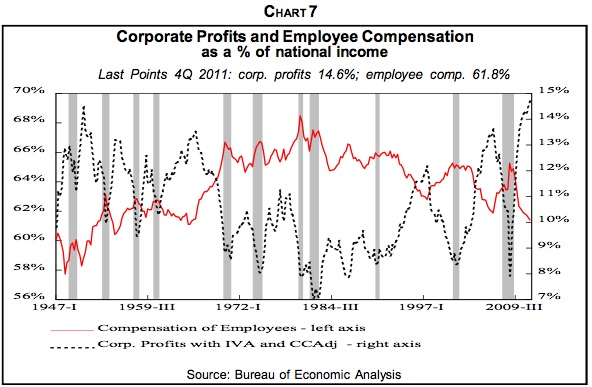
So the route to higher profits has been cost-cutting and productivity enhancement. Labor costs are the largest category for most firms, certainly the largest over which they have much control. So the massive layoffs in 2009-2011 ensued. The result was rapid productivity growth in 2009-2010 (Chart 6). And since employment costs have been running at a steady and low annual rate of about 2%, the productivity gains flowed through to declining unit labor costs. The labor cost per physical unit of output also equals the ratio of labor compensation per hour to productivity or output per hour. As a result, the sales volume growth in 2009-2010 required few new employees or even reduced staff in many firms. This cost-cutting has been so effective that, coupled with the revival of financial sector earnings, corporate profits as a share of national income hit an all-time high in the fourth quarter of 2011 (Chart 7). Notice the inverse correlation between profits and labor compensation shares of national income.
Manufacturing Productivity
Manufacturing is an interesting case in point. Labor-intensive factories producing textiles, shoes, etc. have long departed American shores for low-cost venues abroad and may never return. What's left in this country, and what's coming back in the much ballyhooed "reshoring," is robot-intensive, highly automated production that requires limited labor. Manufacturing output has recovered from its recessionary low but not to the previous peak. But output per person, however, after the usual recessionary decline, has resumed its robust upward trend. So the long-term decline in manufacturing employment has only been arrested of late with no meaningful job gains. Indeed, after falling by 5.8 million from January 2000 to January 2010 and by 2.3 million just from the start of the recession in December 2007, factory jobs have gained only 433,000.
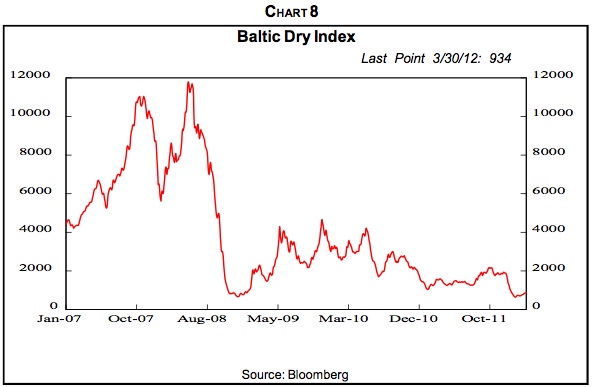
These trends will no doubt persist, with U.S. manufacturing growing but not with much benefit to labor. Our good friends at GaveKal point out that the global manufacturing playing field is leveling. Labor costs are rising in China and other emerging lands while factory automation slashes U.S. labor inputs. The Japanese earthquake and tsunami-related supply disruption pointed out the risk of sourcing from distant countries, even though ocean transportation is cheap. Weak demand and the earlier boom-inspired ship-building spree have driven global dry cargo freight costs to very low levels (Chart 8).
So low U.S. domestic energy costs may become an increasing inducement for local manufacturing. Petroleum from Canadian oil sands will continue to pour into the U.S. as pipelines from Alberta are built, and fracking and horizontal drilling will hype domestic production of crude oil and natural gas. These techniques have already collapsed gas prices.
Nothing Else
With close to zero interest rates, interest for savers is small. Dividend yields, at 2.1% for the S&P 500 stocks, aren't a big help either. Those who own rental property are gaining as rents rise with falling vacancies, but falling house prices are reducing the assets of landlords and homeowners alike. The federal payments to individuals from the 2009 and 2010 stimuli are running out, and at the end of this year, unemployment benefits will drop from a maximum 99 weeks to 26 weeks, the individual payroll tax will jump from 4.2% of payroll income to 6.2%, the Bush-era income tax cuts will disappear and across-the-board cuts in federal spending will be triggered—unless Congress acts to extend these measures, which it probably will do, especially if the economy is weak. Otherwise, the effects of tax increases and spending cuts will equal about 3.5% and guarantee a recession in an inherently slowly-growing economy.
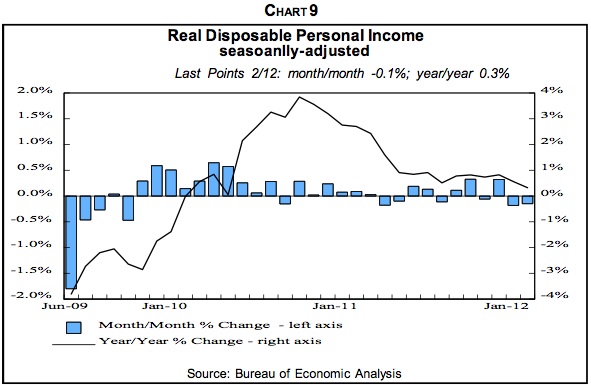
At the same time, pay per employee is rising slowly and continues to fall in real terms. So increased jobs remain the key to any increases in real household after-tax incomes, which are now growing at a mere 0.3% in February vs. February 2011 (Chart 9).
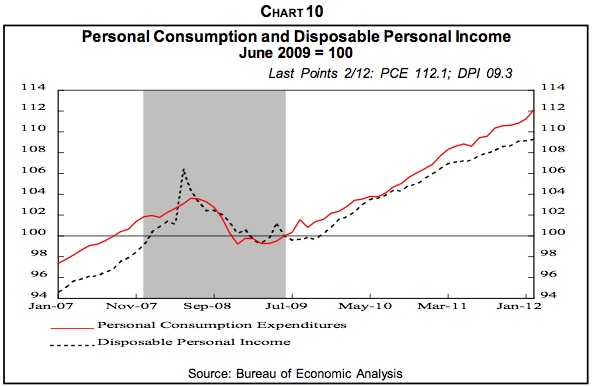
On balance, what will new employees do with their paychecks? Will they spend them and create more consumer demand, more corporate profits, more jobs, etc. in a self-feeding cycle? Or will households on average save more to rebuild assets, reduce debt and bring spending back in line with incomes (Chart 10), as we forecast in our Dec. 2011 report?
Free Housing
On the other side of the ledger, a recent phenomenon does not increase reported household incomes but has increased the purchasing power of homeowners whose mortgages are delinquent or in foreclosure but who are still living in their houses rent-free. Many people who are technically homeowners are really already renters, with an option on their houses' appreciation. They put little if anything down, even a negative number when their home improvement loans piggybacked on first mortgages and brought the total indebtedness to more than 100% of the houses' values. Many also planned to refinance their mortgages with cash-outs due to appreciation before their mortgage rates reset upward or, in some cases, even before they skipped enough monthly payments to be foreclosed.
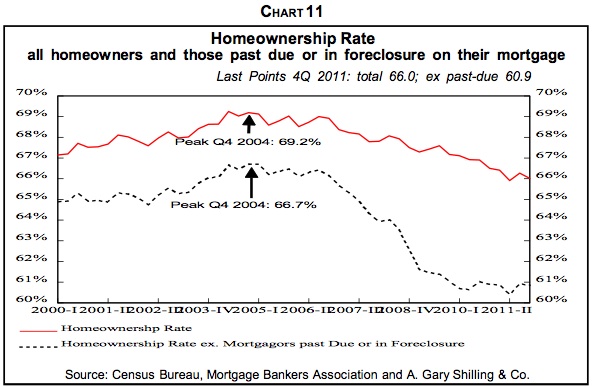
The dashed line in Chart 11 is the homeownership rate after subtracting delinquent and foreclosed mortgages. Starting in 2006, the gap between that measure and total home ownership has opened from 2.5 percentage points to 5.1 points in the fourth quarter.
The 3.1 million additional people who aren't paying their mortgages are essentially living rent-free by not paying their monthly $1,721 mortgage payments, assuming they're still living in those houses and that their skipped payments are the same as the national average. Since 2006, they have increased their purchasing power by $64 billion at annual rates, or the equivalent of 5.4% of after-tax income.
Spending, Saving And Debt
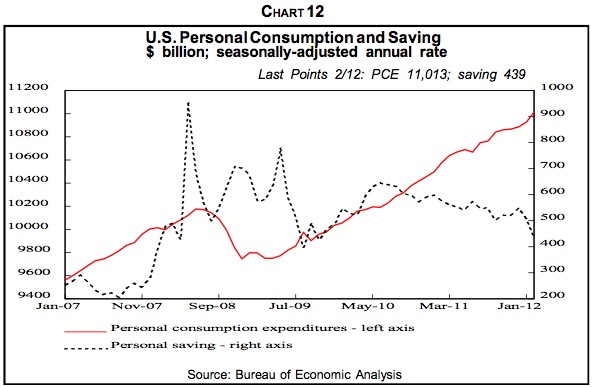
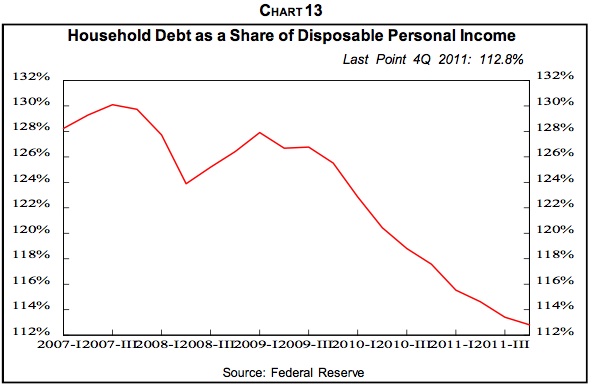
After higher gasoline costs, money generated by living rent-free and other side issues are factored in, the bottom line is that U.S. consumer spending has been rising while saving has dropped (Chart 12). Household debt, including mortgages, student, auto and credit card loans, has fallen relative to disposable personal income (Chart 13) but largely because of writeoffs of troubled mortgages, according to our analysis of incomplete data. Revolving consumer credit, largely on credit cards, is no longer being liquidated.
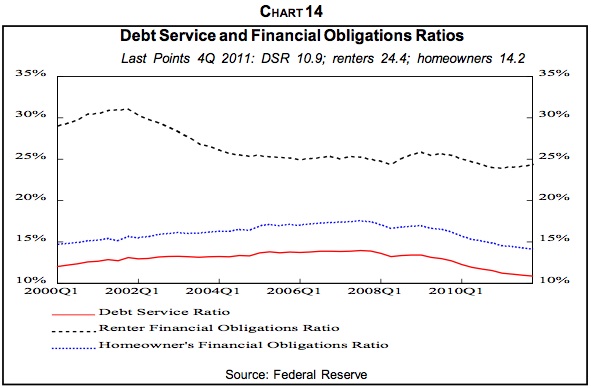
The Debt Service Ratio (Chart 14) measures the percentage of monthly DPI required to make principal and interest payments on revolving, non-revolving and mortgage debt, and its recent decline reflects declining interest rates as well as some debt repayment and chargeoffs. The Homeowner Financial Obligations Ratio adds in insurance, utility and other ongoing homeowner costs and shows a similar recent decline. With rising rents, however, the Renter Financial Obligations ratio has risen lately. So the incentive to borrow more because of lower monthly payments may exist for homeowners but not renters.
So, contrary to my steadfast belief that consumers are being forced to save more and reduce debt to rebuild net worth, they've been doing the opposite lately. In making my case for a long run saving spree, I point to the volatility of stocks starting in 2000 that ended the conviction of many individual shareholders in the 1980s and 1990s that ever-rising stock portfolios would substitute for saving out of current income and put their kids through college, finance early retirement and pay for a few ‘round-the-world cruises in between.
But with the 2000-2002 dot com-led stock collapse and the 2007-2009 subprime mortgage-headed nosedive, investors have suffered through two of only five declines of over 40% in the stock market since 1900. Furthermore, the S&P 500 index was dead flat in 2011 and went nowhere since 1998, 13 years of drought. In response, investors continue to exit U.S. equity mutual funds and pour money into bond funds.
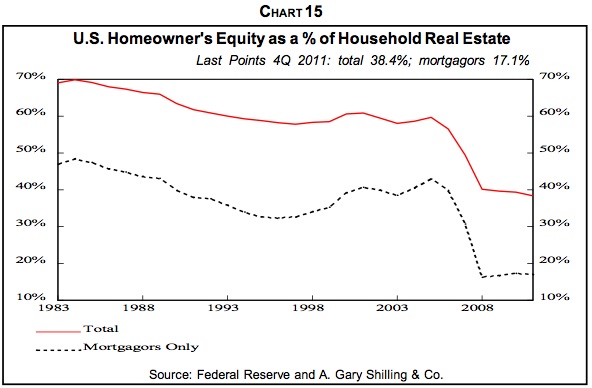
Furthermore, few homeowners any longer have home equity they can tap through home equity loans and cash-out refinancing to finance oversized spending, despite low mortgage rates. Stringent refinancing standards, the reality that 23% of mortgages are under water and worth more than the underlying houses and refinancing costs keep many from partaking. As a result of earlier equity withdrawal and the collapse in house prices, the average home equity of mortgagors has dropped from almost 50% in the early 1980s to 17% (Chart 15).
The postwar babies have been notoriously poor savers and ill-prepared for retirement expenses. Many are now in their 50s and can save since they're in their peak career earning years and they no longer have college tuition payments for their kids. Also, the continuing lousy job market is no doubt encouraging those who still have jobs to save for possible unemployment. We believe that the household saving rate will return to at least the 12% level of the early 1980s from which it fell for 25 years and that the total household debt-to-DPI ratio will return to its 65% norm.
Consumer Retrenchment
The data so far are not conclusive, but evidence of U.S. consumer retrenchment is appearing. Consumer confidence has been relatively steady but may be headed down, and in any event, remains far below the levels of early 2007 before the the Great Recession. Real personal consumption expenditures growth has been volatile in recent months and falling on a year-over-year basis. Voluntary quits from jobs, another measure of confidence, may be turning down. And consumer spending will no doubt have a big slide if my forecast of another 20% fall in house prices pans out.
State and Local Governments
As I've discussed in past Insights and inThe Age of Deleveraging, state and local spending used to be a stable component of GDP, so stable that even though at about 12% it is the second largest component of GDP behind consumer spending, few paid much attention to it. But the Great Recession devastated income and sales tax collections on the state level and the collapse in real estate valuations is still depressing local government revenues.
State revenues have reversed along with corporate and individual incomes as well as retail sales, but much of the federal fiscal stimuli enacted in 2009 that went to states to keep teachers employed, finance infrastructure projects, etc. is running out. So with voters opposed to tax hikes, most state budgets are still stressed while local governments contend with falling real estate assessments and taxes.
Then there are the vastly underfunded state and local defined benefit pension funds, which are much more so when realistic assumptions of future investment returns and the present value of future benefits are considered. Giant California Public Employee Retirement System recently reduced its discounting rate on future benefits from 8% to 7.5%. That increases the present value of those liabilities, but 7.5% is still higher than the yield on investment-grade corporate bonds, now 5.2%, that corporate pension funds generally use as their discount rate. As assumptions on future investment returns and the discounting rate on future benefits are cut, the present value gap between assets and liabilities widens and increased current contributions to their pension funds are required by municipal governments.
As I've covered in past Insights, municipal governments are being forced to take drastic steps such as converting to defined contribution pension plans, especially for new employees; cutting salaries; increasing existing employee and retiree shares of healthcare costs and laying people off.
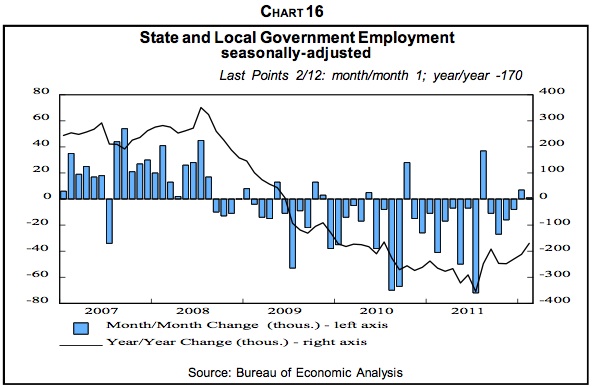
Total payroll employment peaked in January 2008 and fell by 5.33 million, or 3.9%, from then through February 2012. State and local job counts peaked later, in August 2008, and has dropped by 647,000, or 3.3%, since then. That's a bigger percentage drop than the 3.0% for the total since August 2008 and accounts for 15.9% of the overall 4.07 million jobs lost. With a number of local governments in or near bankruptcy and many budget gaps still wide, layoffs and other cost-cutting measures can be expected to persist (Chart 16).
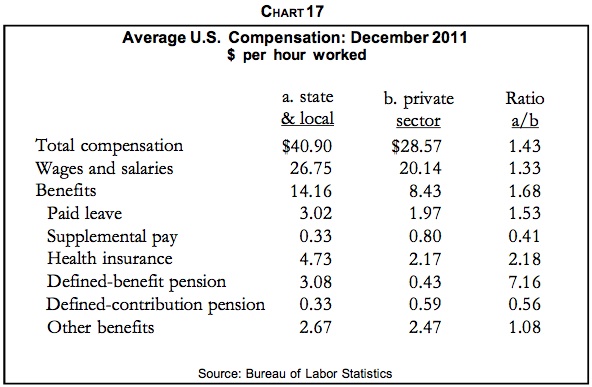
Furthermore, in terms of income lost, the elimination of two municipal employees is the equivalent of almost three private sector terminations. On average, municipal employees are paid 43% more than private sector workers, 33% more in wages and salaries and 68% more in benefits (Chart 17).
Commercial Real Estate and Capital Equipment
Capital spending continues to be of limited help to the economy. Nonresidential structures, along with other real estate, was hard hit by the Great Recession and remains weak as capacity remains ample and prices of commercial real estate generally well below the 2007 peak. The two exceptions are rental apartments and medical office buildings.
Capital equipment and software spending is a small sector, only accounting for 8.7% of GDP in the fourth quarter, but a volatile one. It was also hit hard by the Great Recession, but has since revived on the back of equipment and software that enhanced productivity. This is part of the cost-cutting zeal by business. Equipment that is more aimed at increasing capacity remains depressed, however, by ample excess capacity. My analysis shows that it is the level of capacity utilization, much more than its rate of change, that determines capital equipment spending. Despite recent increases in operating rates, capacity utilization remains well below the levels that normally trigger capital spending sprees. When equipment remains unutilized, there's little zeal to build more of it. Furthermore, the growth in new orders for nondefense capital goods ex aircraft, which gives a clue on yet-to-be reported capital equipment spending, is falling.
Exports
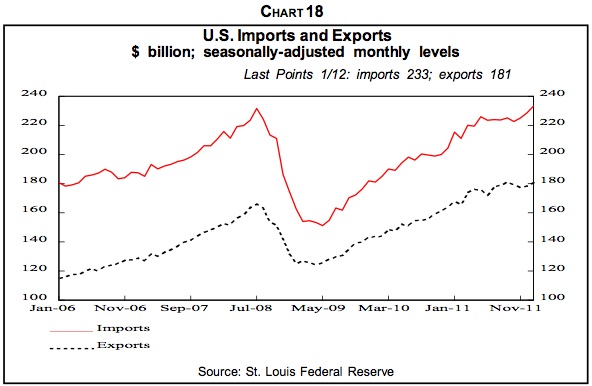
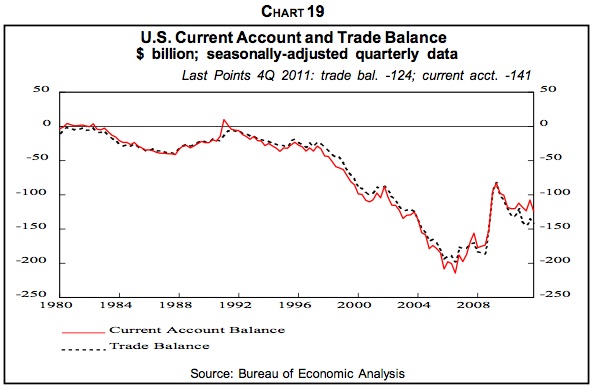
Net export growth can also spur economic growth, but the outlook isn't robust. When U.S. consumers retrenched starting in the second half of 2008, they bought less of everything, including imported goods and services. Consequently, U.S. imports fell less than exports declined (Chart 18) and the trade and current account balances narrowed (Chart 19). Subsequently, those deficits have widened as export growth failed to keep up with the rise in imports.
Renewed retrenchment by U.S. consumers will again soften imports, but the unfolding major recession in Europe and a hard landing in China, as I've covered in past Insights, will curb export growth. At the same time, the mushrooming of U.S. energy output is shrinking the imports needed to shrink the gap between U.S. production and consumption. Recently, America returned to being a net exporter of petroleum products.
Overall Indicators
Despite the euphoria of investors over U.S. stocks until recently, I believe the economy is likely to weaken as the year progresses, led by renewed consumer retrenchment. A number of overall economic indicators point in that direction. The Economic Cycle Research Institute (ECRI) index remains in recession territory. The ratio of coincident to lagging economic indicators, often a better leading indicator than the leading indicator index itself, is declining. Electricity generation, although influenced by the warm winter, is falling rapidly.
GDP is accelerating in recent quarters, but not after inventory investment is removed to yield final sales. In the fourth quarter, inventory growth accounted for 60% of the rise in GDP, and that accumulation may not have been desired, suggesting future production cutbacks. Industrial production growth is already sliding. The liquidation of excess inventories accounts for a major share of the decline in economic activity in recessions.
Recall that late last year, retailers, worried about being stuck with unsold Christmas goods as in 2010, held early sales, even opening on Thanksgiving day. The possibility that inventories are already more than desired is also suggested by the recent decline in containers coming into the Ports of Los Angeles and Long Beach, the principal entry points for Asian imports, and the slide in U.S. rail ton miles.
Finally, the U.S. economy is overdue for a recession. We believe that in 2000, it entered the down phase of the long cycle, and the five to seven years that we believe remain in the age of deleveraging is part of this period of weak economic growth and more frequent recessions. History, as I've shown in past Insights and in The Age of Deleveraging, reveals an average business cycle length of 3.7 years in the down phase. The economy peak in the fourth quarter of 2007, 4.25 years ago, so the cycle is long in the tooth.
Risk On!
Either we're dead wrong on the outlook or investors are ignoring reality as they emphasize "risk on" trades. Stocks have been strong except for defensive, dividend-payers like utilities that investors have ignored. Treasury yields recently spiked (and prices plunged as investors switched to riskier securities.
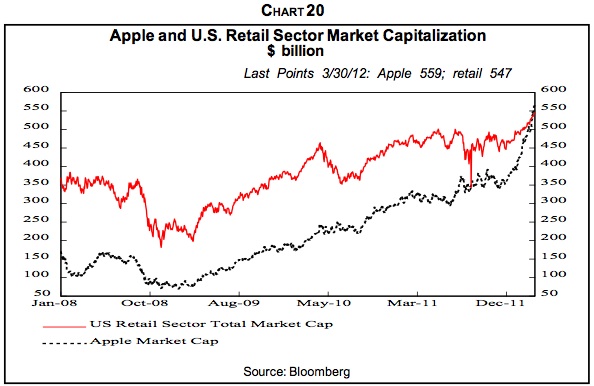
And, of course, we realize that civilization would come to a grinding halt without Apple iPhones, which my wife and I own, and iPads, which she loves. But when the market capitalization of that one stock equals that of the entire retail sector (Chart 20), is it remotely possible that speculation is afoot?
The early 1970s was the era of the Nifty Fifty "one decision" stocks, companies with such wonderful long-run growth prospects that investors only needed to buy them and never worry about selling. The list narrowed as various icons fell from grace but the true believers never flinched. We got extremely concerned when the interest focused on four companies—McDonald's, Polaroid, Walt Disney Co. and Winnebago. It struck us then that hamburger stands, gimmick cameras, amusement parks and motor homes were the limbs and outward flourishes—and not the soul—of the economy. If investors were avoiding just about everything else, they were implying that the economy was in trouble. This, along with the massive but generally unrecognized inventory buildup, led us to successfully forecast the 1973-1975 recession, up until then the worst since the 1930s.
By John F. Mauldin
Outside the Box is a free weekly economic e-letter by best-selling author and renowned financial expert, John Mauldin. You can learn more and get your free subscription by visiting www.JohnMauldin.com.
Please write to johnmauldin@2000wave.com to inform us of any reproductions, including when and where copy will be reproduced. You must keep the letter intact, from introduction to disclaimers. If you would like to quote brief portions only, please reference www.JohnMauldin.com.
John Mauldin, Best-Selling author and recognized financial expert, is also editor of the free Thoughts From the Frontline that goes to over 1 million readers each week. For more information on John or his FREE weekly economic letter go to: http://www.frontlinethoughts.com/
To subscribe to John Mauldin's E-Letter please click here:http://www.frontlinethoughts.com/subscribe.asp
Copyright 2012 John Mauldin. All Rights Reserved
Note: John Mauldin is the President of Millennium Wave Advisors, LLC (MWA), which is an investment advisory firm registered with multiple states. John Mauldin is a registered representative of Millennium Wave Securities, LLC, (MWS), an FINRA registered broker-dealer. MWS is also a Commodity Pool Operator (CPO) and a Commodity Trading Advisor (CTA) registered with the CFTC, as well as an Introducing Broker (IB). Millennium Wave Investments is a dba of MWA LLC and MWS LLC. Millennium Wave Investments cooperates in the consulting on and marketing of private investment offerings with other independent firms such as Altegris Investments; Absolute Return Partners, LLP; Plexus Asset Management; Fynn Capital; and Nicola Wealth Management. Funds recommended by Mauldin may pay a portion of their fees to these independent firms, who will share 1/3 of those fees with MWS and thus with Mauldin. Any views expressed herein are provided for information purposes only and should not be construed in any way as an offer, an endorsement, or inducement to invest with any CTA, fund, or program mentioned here or elsewhere. Before seeking any advisor's services or making an investment in a fund, investors must read and examine thoroughly the respective disclosure document or offering memorandum. Since these firms and Mauldin receive fees from the funds they recommend/market, they only recommend/market products with which they have been able to negotiate fee arrangements.
Opinions expressed in these reports may change without prior notice. John Mauldin and/or the staffs at Millennium Wave Advisors, LLC and InvestorsInsight Publishing, Inc. ("InvestorsInsight") may or may not have investments in any funds cited above.
Disclaimer PAST RESULTS ARE NOT INDICATIVE OF FUTURE RESULTS. THERE IS RISK OF LOSS AS WELL AS THE OPPORTUNITY FOR GAIN WHEN INVESTING IN MANAGED FUNDS. WHEN CONSIDERING ALTERNATIVE INVESTMENTS, INCLUDING HEDGE FUNDS, YOU SHOULD CONSIDER VARIOUS RISKS INCLUDING THE FACT THAT SOME PRODUCTS: OFTEN ENGAGE IN LEVERAGING AND OTHER SPECULATIVE INVESTMENT PRACTICES THAT MAY INCREASE THE RISK OF INVESTMENT LOSS, CAN BE ILLIQUID, ARE NOT REQUIRED TO PROVIDE PERIODIC PRICING OR VALUATION INFORMATION TO INVESTORS, MAY INVOLVE COMPLEX TAX STRUCTURES AND DELAYS IN DISTRIBUTING IMPORTANT TAX INFORMATION, ARE NOT SUBJECT TO THE SAME REGULATORY REQUIREMENTS AS MUTUAL FUNDS, OFTEN CHARGE HIGH FEES, AND IN MANY CASES THE UNDERLYING INVESTMENTS ARE NOT TRANSPARENT AND ARE KNOWN ONLY TO THE INVESTMENT MANAGER.
John Mauldin Archive |
© 2005-2022 http://www.MarketOracle.co.uk - The Market Oracle is a FREE Daily Financial Markets Analysis & Forecasting online publication.